Useful Links
Social
Bilston, West Midlands House Prices: Up, Down or Holding?
Track housing activity in Bilston with regular updates on price averages and the number of completed property sales.
Furthermore, you’ll spot the areas where values have not only risen but remained stable - a strong signal of underlying demand and buyer trust.
How much is your Bilston home worth?
Get a personalised estimate based on recent local sales and property type.
What Should Properties in Bilston Cost?
Property Type Breakdown
How big is the property?
Choose your comparison:
Bilston House Prices - Summary
An overview of house prices in Bilston since 2022.
House Prices > Bilston
| Year | Average Price | Transactions |
|---|---|---|
| 2025 (proj.) | £200,000 | 566 |
| 2024 | £189,300 | 363 |
| 2023 | £185,000 | 460 |
| 2022 | £185,200 | 570 |
| 2021 | £181,900 | 728 |
| 2020 | £164,600 | 614 |
| 2019 | £140,500 | 578 |
| 2018 | £137,500 | 647 |
Once upon a rather lively year in Bilston, house prices started to twist and turn like a merry-go-round at the town fair. Over recent years, the local market has been especially buoyant, unpredictable and full of surprises.
The story isn’t just one of ‘up and up’. It’s more like a quirky Midlands waltz - home values stride upwards, then pause, and sometimes take a sideways step, while total transactions scuttle and skip in their own direction. Let’s unpack a few of the most colourful threads:
- Property prices in Bilston have been bouncing around like a rubber ball in a small room. Between 2018 and 2025, average values have seen stretchy leaps of over 45% in seven years, even with the occasional stutter.
- Transaction numbers, though, tell a gloomier tale. Sales have dipped, with just 363 properties changing hands in 2024, compared to a much fresher 647 transactions only a few years before.
- This mismatch between soaring prices and dwindling moves hints at growing competition and sometimes, perhaps, a touch of local hesitancy.
Thinking of stepping onto the Bilston property ladder? You’ll need persistence and perhaps a touch of good timing, because the pace is brisk, but the choices can feel tight. At M0VE, we’ve watched families and first-time buyers alike chase the dream, lured by potential value, but sometimes edged out by quick-moving rivals. Even so, with prices edging up again in 2025, those sticking around could find themselves in a slightly stronger spot - if the stars align.
So, what should we remember? Bilston’s market certainly isn't sleepy. It hums and chatters, sometimes boisterously, rarely dull, and always leaves a trail of fresh tales along its terraced streets.
Fancy knowing what homes are going for in Bilston? Have a look at the latest houses for sale in Bilston.
House Prices in Bilston by Property Type

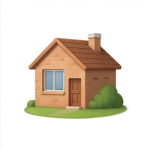
Detached
Avg. Property Price: £252,000
Avg. Size of Property
1,059 sq/ft
Avg. Cost Per Sq/ft
£248 sq/ft
Total transactions
260 (since 2021)

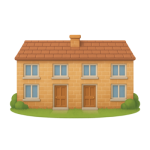
Semi-detached
Avg. Property Price: £174,900
Avg. Size of Property
891 sq/ft
Avg. Cost Per Sq/ft
£201 sq/ft
Total transactions
738 (since 2021)

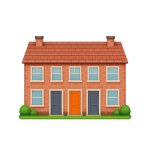
Terraces
Avg. Property Price: £153,100
Avg. Size of Property
852 sq/ft
Avg. Cost Per Sq/ft
£186 sq/ft
Total transactions
478 (since 2021)

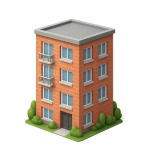
Apartments
Avg. Property Price: £92,700
Avg. Size of Property
614 sq/ft
Avg. Cost Per Sq/ft
£156 sq/ft
Total transactions
103 (since 2021)
Bilston’s property snapshot since 2021 is nothing short of dynamic, with a remarkably varied spread between property types. Blink and you might miss a sale – these homes have not been hanging around on the market. In the time it takes to have a cuppa at a Bilston café, another semi, terrace or flat could be snapped up by a savvy buyer.
Detached homes currently set the ceiling for price and space, offering the largest average size and commanding higher values per transaction. This points to sustained demand among buyers who crave plenty of room to sprawl out. We’ve seen that those choosing detached homes often want not just four walls and a roof, but ample gardens, privacy, and a quiet escape from the urban fray.
Yet, it’s the semi-detached and terraced homes driving volume with an energetic pace. Semi-detached properties pile up the highest number of transactions in Bilston since 2021, which tells us families and first-time buyers remain laser-focused on homes that blend space with affordability. The cost per square foot for semis and terraced types lands in an attractive mid-range, offering decent value for those stretching every pound.
- Terraced properties, often wrapped in lovely brickwork and character, have held their ground through shifting market winds. Their popularity proves that buyers here still appreciate traditional layouts mixed with urban convenience.
- Flats, while at the more affordable end of the spectrum, see a smaller number of buyers. Their modest average size and lower entry price attract young professionals, downsizers or those investing in a first buy-to-let.
With that said, competition for homes, especially semi-detached styles, is fierce – faster than a Bilston bus in rush hour. If you’re house-hunting, speed and preparation count for even more now.
To get a more precise grip on how these price patterns affect you, check out our guide: Understanding House Prices in Bilston: What’s Your Property Value?
So, what should we remember?
- Detached homes offer maximum living space, with a premium price tag to match.
- Semi-detached and terraced homes remain the beating heart of Bilston’s market, moving with impressive speed and delivering that sweet spot between size and cost.
- Flats give buyers the most affordable entry to Bilston life, with lower price-per-square-foot for those seeking value or starting out.
Average Property Prices by Bilston Postcode Area
| District | Avg Price (£) | Transactions |
|---|---|---|
| WV2 | £182,500 | 1 |
| WV14 | £167,600 | 3,987 |
Looking at Bilston’s property market by postcode, we see a noteworthy contrast in both the number of property transactions and the level of local demand. The difference between the WV2 and WV14 districts is impossible to ignore, with activity in one vastly eclipsing the other. If you’re weighing your options as a buyer or seller, these figures offer a gentle but important warning: your postcode makes a big difference in price expectations and market movement.
WV14 registers an exceptionally high transaction count, dwarfing other areas in Bilston. Here, sales move at a much brisker pace, with homes often attracting both local movers and newcomers. It’s a bustling patchwork of family homes, terraces, and newer developments, and the sheer volume of activity suggests a busy marketplace where competition can be fierce.
In sharp contrast, WV2 stands out not for the price tag attached to its properties, but for its strikingly low turnover. With that said, buyers considering WV2 may find tranquil neighbourhoods and less frantic bidding wars, but they should also tread carefully if seeking quick resale or strong short-term growth.
- Let’s not get carried away by headline figures – high transaction numbers do not always mean easier sales or guaranteed appreciation.
- If you’re thinking of buying, step back and consider both liquidity and long-term value trends in your chosen district.
- For sellers, district choice could mean the difference between a rapid-fire sale and a protracted wait for the right buyer.
So, what should we remember? Every Bilston district is its own unique micro-market. Decisions made in haste may quickly unravel, so do your homework and let the data guide your next step. A steady, measured approach is still the safest bet.
Are Bilston House Prices Higher Than Nearby Towns?
| City | Avg Price (£) | Transactions |
|---|---|---|
| Tipton | £155,800 | 2,902 |
| Wednesbury | £160,500 | 3,077 |
| Dudley | £184,200 | 7,435 |
| Willenhall | £169,500 | 3,682 |
| Wolverhampton | £207,500 | 18,880 |
| West Bromwich | £180,200 | 3,716 |
| Rowley Regis | £180,800 | 1,870 |
| Kingswinford | £244,200 | 2,796 |
| Oldbury | £184,200 | 3,971 |
| Brierley Hill | £175,200 | 3,132 |
House prices in Bilston’s neighbourhoods change shape like the Black Country canal paths, twisting with each town. You will find pockets of affordability in Tipton and Wednesbury, drawing first-time buyers who are after that ever-elusive combination: decent space and a fair price. These areas buzz with local amenities-think proper high street butchers, budget cafes, and lively community parks-often with sale prices that turn heads far beyond the Midlands.
Move further out and you step into places where prices jump up like daffodils after rain. Wolverhampton, for example, is a prime example of an area that commands a higher average property value. Its vibrant centre and truly superb transport links ramp up demand, bolstering prices. Families searching for a period terrace or something with real character circle Dudley and Oldbury, where the draw often lies in larger gardens or roomy semi-detached houses that still sit beneath those higher city-centre price brackets.
- Bilston slides comfortably in the middle bracket-not the cheapest, not the priciest. For many, it is the classic “just right” Goldilocks zone, with prices that seldom cause heart palpitations but rarely dip below neighbouring bargains.
- Local buyers craving more for their pound often jump west toward Willenhall and Brierley Hill, where value is keen and communities feel close-knit, like the Friday market crowd on a busy morning.
- If you are scouting for aspirational living, Kingswinford sets the bar higher with leafy streets, larger homes, and a price tag to prove it. Yet the market there is steadier, reflecting a quieter, less transient crowd.
Bounce back towards West Bromwich and Rowley Regis if urban bustle and strong road links matter, but expect a step up in what you pay, especially when modern apartments come up for sale. Even so, price fluctuations across these areas in recent years have been bouncing around like a rubber ball in a small room-sometimes unpredictable, other times remarkably sluggish.
So, what are the key takeaway points?
- Bilston’s blend of price and lifestyle suits a wide range of buyers seeking balance rather than extremes.
- For budget-focused house hunters, the eastern Black Country (think Tipton and Wednesbury) keeps things affordable but lively.
- If aspirational living or city-centric amenities are your priorities, expect to pay more for proximity, space, or neighbourhood prestige.
In this patchwork of prices and personalities, Bilston stands out for its sensible, grounded appeal. That’s a draw for buyers wanting a strong community without wild price swings or big city sticker shock.
Please remember, these figures compare only average property prices and the number of transactions recorded.
Property size and cost per square foot are not factored in, meaning some shifts may be missed. To explore further, visit our blog.
Data You Can Depend On
Our valuation engine isn’t loud, but it is razor-sharp. It reads EPC and sales data with unusual precision and outputs pricing that feels right (because it is). Check the process we use to refine data

