Useful Links
Social
Shrewsbury House Price Breakdown: Trends and Local Data
Get a breakdown of home sales across Shrewsbury by district and category, using six years of year-on-year data and external market comparisons.
You’ll also see which areas are gaining traction - and which are still catching up when compared to nearby cities.
How much is your Shrewsbury home worth?
Get a personalised estimate based on recent local sales and property type.
What Should Properties in Shrewsbury Cost?
Property Type Breakdown
How big is the property?
Choose your comparison:
Shrewsbury House Prices - Summary
An overview of house prices in Shrewsbury since 2022.
House Prices > Shrewsbury
| Year | Average Price | Transactions |
|---|---|---|
| 2025 (proj.) | £316,600 | 2,491 |
| 2024 | £305,600 | 1,671 |
| 2023 | £306,000 | 2,178 |
| 2022 | £303,500 | 2,547 |
| 2021 | £287,300 | 3,289 |
| 2020 | £265,000 | 2,218 |
| 2019 | £251,700 | 2,748 |
| 2018 | £247,700 | 2,785 |
Year-on-Year Property Prices: What’s Happening in Shrewsbury?
Anyone keeping an eagle eye on the market will have spotted that house prices in Shrewsbury have done a thoroughly impressive job of climbing upwards since 2018. Even those savvy locals waiting for a “cool-off” will have noticed that any price “pause” was about as brief as a Shrewsbury drizzle - there for a moment, then right back to sunny growth.
- From 2018’s steady values to a predicted 2025 peak, the average property price has bumped up noticeably, brushing off national wobbles with almost stubborn optimism.
- The bold leap in 2021 is difficult to ignore – prices and transaction numbers both spiked, not unlike queues piling up at Shrewsbury’s Saturday market. That pandemic-fuelled rush resulted in homes being snapped up with lightning speed and minimal fuss.
- We’ve also seen transactions swing from year to year, reflecting everything from changing mortgage rates to the quirks of buyer confidence. 2023 and 2024, in particular, saw activity dip, though prices have stayed resolutely high – a true sign that demand still runs hot (or sellers are simply feeling brave).
- As we inch towards 2025, the projected jump in average house price combined with a rise in transactions suggests Shrewsbury may soon see bidding wars heating up faster than a barbecue on the Quarry in July.
For those considering making a move, timing and location are everything. The city’s desirability isn’t waning, and houses in the most sought-after areas are about as elusive as a sunny bank holiday. As we’ve seen at M0VE, some of the suburban roads in Belle Vue continue to attract buyers with pockets deeper than the River Severn after a wet winter.
For even more detailed advice on spotting value and growth areas amidst all the excitement, we’d recommend checking out our guide to Shrewsbury Streets with the Best Mix of Value & Growth Potential.
So, what are the key takeaway points?
- Price growth is persistent – hesitation rarely pays off if you’re hoping for a dramatic dip anytime soon.
- Competition is intense – especially in prime locations, expect to face swift offers and quick-moving buyers.
- If you’re ready to pounce, a bit of local know-how (and a touch of patience) might just be your greatest asset.
Ready to take the next step? See what’s out there among the latest Shrewsbury property listings.
Breakdown of Shrewsbury House Prices by Type

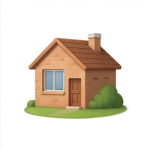
Detached
Avg. Property Price: £401,700
Avg. Size of Property
1,369 sq/ft
Avg. Cost Per Sq/ft
£303 sq/ft
Total transactions
1,862 (since 2021)

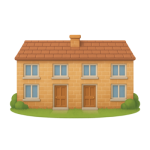
Semi-detached
Avg. Property Price: £263,100
Avg. Size of Property
946 sq/ft
Avg. Cost Per Sq/ft
£282 sq/ft
Total transactions
1,820 (since 2021)

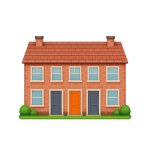
Terraces
Avg. Property Price: £210,000
Avg. Size of Property
808 sq/ft
Avg. Cost Per Sq/ft
£265 sq/ft
Total transactions
1,553 (since 2021)

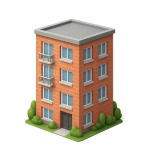
Apartments
Avg. Property Price: £160,500
Avg. Size of Property
627 sq/ft
Avg. Cost Per Sq/ft
£253 sq/ft
Total transactions
197 (since 2021)
The Shrewsbury property scene reads almost like a patchwork quilt - intricate, appealing, but hiding a few prickly seams beneath the surface figures. At first glance, you’d be tempted to call it buoyant, especially if you only skim the headlines. Peer closer though and a curious mix of opportunity, pressure and deep-rooted regional behaviour comes sharply into focus.
Detached properties, topping the pile with an average price that dwarfs the rest, clearly attract buyers seeking prestige, privacy, and significant space - the average size here easily eclipses the rest of the market at a hefty 1,360 sq/ft. Yet is this exclusive market moving as feverishly as it looks? The 1,831 transactions since 2021 signal sustained demand, but one wonders whether these larger pads are attracting seasoned movers upsizing for good, or whether first-timers are quietly priced out. That £300 per sq/ft is a formidable threshold and might leave some would-be buyers feeling almost like they need to win the Shrewsbury lottery to compete.
Notably, flats represent a quieter, less frenzied market segment. Savvy buyers and investors may spot the slender 630 sq/ft footprint and modest £160,500 average price, but the total of just 195 sales could hint at a sluggish pace or perhaps an undersupplied category. Is this a sign young professionals are being squeezed out, or are buy-to-let rules biting here? If you’re thinking about flats, expectations in Shrewsbury might need a rethink - competition is much lighter but so are the options.
Meanwhile, semi-detached and terraced options, the workhorses of Shrewsbury’s property market, paint a picture of what families and budget-conscious buyers are actually securing. Their average prices split the difference, meaning the squeeze isn’t quite as fierce as up the detached end, but far from comfortable for every buyer, either. We’ve noticed semi-detached homes, with 1,803 transactions in the tally, carry sizeable 950 sq/ft footprints at a fairly robust £280 per sq/ft. Terraced homes, just below that, still shift in high volumes (1,544), giving a slim lifeline to local buyers hoping to plant roots.
With that said, there’s a faint but growing sense that affordability is slipping, and entry-level buyers in Shrewsbury can find getting an offer accepted about as likely as finding a quiet lane in the Quarry on a sunny Sunday. The cost-per-square-foot gap between property types, although not extreme, remains persistent and could widen, making those 'starter' homes ever more significant for local growth.
See how to avoid underselling in ShrewsburySo, what are the key takeaway points?
- Detached homes cost an absolute premium in Shrewsbury, but demand is unwavering. Families need serious budgets to compete for real space and status.
- Flats remain a niche segment. Fewer sales, smaller sizes and lighter demand leave the door ajar for opportunistic buyers but little real buzz for most.
- Semi-detached and terraced homes are where the action is for typical buyers. Yet, even here, prices are marching upwards, and competition can be ruthless.
Where Are House Prices Rising Most in Shrewsbury?
| District | Avg Price (£) | Transactions |
|---|---|---|
| SY1 | £218,400 | 3,457 |
| SY2 | £270,400 | 3,660 |
| SY3 | £285,300 | 4,614 |
| SY4 | £312,300 | 3,185 |
| SY5 | £320,100 | 2,645 |
The property scene in Shrewsbury right now is a rollercoaster ride - thrilling for some, a touch dizzying for others. With a quick glance at the numbers, you might think the market has picked up a double shot of espresso. Prices leap swiftly from one district to another, and the volume of transactions rivals the speed of queues at Shrewsbury’s Buttermarket on a Saturday morning.
Let’s start with the lower end. The most wallet-friendly spots are clustered nearer the centre; perfect if you like your commute as short as your patience and your takeaways as fast as your broadband. But, don't be fooled, finding a real bargain here’s a bit like searching for parking during the Flower Show - not impossible, but optimism may only get you so far.
Then, as you branch out towards those leafier postcodes (yes, you SY5 and SY4), the prices seem to grow in tandem with the gardens. While the numbers climb, the volume of transactions gets a tad more modest - people here tend to set down roots firmer than the town’s medieval timber frames. If you have the budget for it, you'll get a slice of tranquil, gently undulating Shropshire countryside thrown in for good measure, and yes, perhaps slightly snootier neighbours.
- Central districts (SY1, SY2): Still vibrant and in-demand, especially for first-timers and young professionals. Blink and you might miss the best deals.
- Outer districts (SY3, SY4, SY5): More expensive, generally more spacious, and the pace slows just enough to hear the church bells on Sunday.
- Transaction volumes: The highest sales activity is in those in-between spots, like SY3, where families hunt for that elusive middle ground of price and quality. Transactions here are brisk without feeling like a rugby scrum at the Croud Meadow turnstiles.
For those wrestling with where their budget will stretch furthest, our guide to Shrewsbury’s best value and growth areas is worth a look. Trust us, it’s less headache-inducing than trying to outbid everyone in SY2 at once.
So, what are the key takeaway points?
- Shrewsbury’s property market is anything but predictable: Prices and transactions dance about between districts like Morris dancers in The Square.
- There’s a district for every buyer: Whether you fancy bustling town life or peaceful, countryside calm, your perfect postcode is waiting (just don’t leave it too late, or your neighbour might beat you to it).
- If you want to maximise both value and growth potential, focusing on those mid-tier districts could be your golden ticket – plenty of choice, less drama.
House-hunting in Shrewsbury? Keep your wits about you. Fortune - and flexible budgets - favours the brave.
What Homes Cost in Shrewsbury vs Towns Nearby
| City | Avg Price (£) | Transactions |
|---|---|---|
| Telford | £187,900 | 10,468 |
| Church Stretton | £358,500 | 569 |
| Ellesmere | £234,000 | 753 |
| Oswestry | £227,100 | 2,937 |
| Shifnal | £275,100 | 1,562 |
| Market Drayton | £270,000 | 2,130 |
| Welshpool | £219,200 | 841 |
| Bridgnorth | £272,300 | 1,952 |
| Malpas | £350,700 | 557 |
| Llangollen | £240,800 | 640 |
How do Shrewsbury’s house prices stack up to its neighbours?
Ever wondered if your hard-earned money goes further in Shrewsbury, or if one of the nearby towns offers even sharper value? With homes changing hands in their thousands, it’s a property market that moves faster than a football at New Meadow on a Saturday afternoon.
- There’s a striking variety in price tags across this part of the West Midlands. Some towns flaunt figures that’d make even the most seasoned buyer blink, while others keep things modest and budget-friendly.
- High rollers gravitate to Church Stretton and Malpas, where average prices soar above £350,000. These are locations where gorgeous period properties and open landscapes seem to command an extra premium.
- Telford and Welshpool, by contrast, are great news for buyers looking to keep costs sensible. Average values here sit notably lower, drawing in younger families and first-timers who crave space without the hefty price.
- Transaction activity highlights hot spots: Telford, Oswestry, and Market Drayton notch up plenty of completed sales, showing there's real traction and local churn. That means thousands of completed transactions-the kind of steady movement which underpins healthy, bustling markets.
- You’ll spot some pockets, like Church Stretton and Malpas, where sales numbers are much lighter. These quieter areas are less about fast flips and more about finding your forever home, nestled in tranquil surroundings. Low transaction rates here underline just how settled, and perhaps exclusive, these communities are.
- Buyers need to weigh up priorities: Are you chasing a bigger detached property on a modest budget, or keen to splash out for semi-rural prestige and postcard views? Every town is serving a different slice of the market pie.
Even so, there’s a common thread. Shrewsbury sits almost at the crossroads of aspiration and practicality. Surrounded by towns that offer both ends of the price spectrum, it remains the heart of the local market, offering balance and accessibility few others can match.
Key points to takeaway
- Local prices are anything but flat. Buyers can find something to suit nearly every ambition, from affordable family homes to upscale escapes.
- Transaction levels matter. High sales counts offer choice and vibrancy, while quieter towns provide stability, exclusivity and calm.
- Shrewsbury’s central position is powerful. It bridges regional demand, with rivals offering either lower prices or a more elite edge-not always both.
To summarise: “In Shrewsbury, you get more than bricks and mortar-you join a market as lively as the Quarry Park on carnival day.”
Quick note: these numbers reflect only broad property price averages and transaction volumes.
No adjustments have been made for home sizes or per square foot value. For deeper insights, head over to our blog. Thanks for reading.
Every Figure Checked. Every Detail Counted.
Through clean adjustments to EPC and transaction data, we reveal real pricing trends - without the usual noise or confusion. Walk through our valuation method

