Useful Links
Social
House Prices in Oldbury, West Midlands: Districts, Types and Trends
Browse through home value statistics from across Oldbury, with recent trends and past comparisons included.
You’ll also discover where affordability and demand are finding a stronger middle ground.
How much is your Oldbury home worth?
Get a personalised estimate based on recent local sales and property type.
What Should Properties in Oldbury Cost?
Property Type Breakdown
How big is the property?
Choose your comparison:
Oldbury House Prices - Summary
An overview of house prices in Oldbury since 2022.
House Prices > Oldbury
| Year | Average Price | Transactions |
|---|---|---|
| 2025 (proj.) | £221,900 | 746 |
| 2024 | £211,600 | 573 |
| 2023 | £217,900 | 627 |
| 2022 | £206,400 | 895 |
| 2021 | £189,000 | 951 |
| 2020 | £170,600 | 627 |
| 2019 | £162,100 | 759 |
| 2018 | £160,300 | 789 |
Oldbury’s property market tells a story that's both compelling and unpredictable. Average house values have risen markedly across recent years, with a standout jump in 2021 and another buoyant period in 2022 and 2023. For buyers, that sort of upward momentum can feel as elusive as a parking spot on Sunday near Oldbury town centre.
- Robust price gains in the early 2020s illustrate lingering demand and attractive local amenities.
- Even so, transaction volumes have zigzagged – peaking notably in 2021 before dropping, then showing only a muted rebound by 2025. For sellers, moving a property here sometimes feels like waiting for the next bus – long spells of quiet, followed by quick bursts of action.
- After several years of sustained gains, the modest pullback in 2024 stands out, suggesting a more cautious, value-sensitive market despite high average prices.
What might be fuelling these changes? A potent blend: rising mortgage rates, the aftertaste of pandemic-related moves, and new employment opportunities or regeneration schemes all play a part. Buyer confidence, as well as local wage growth, appears to shape market direction more than speculative momentum.
The Oldbury market has shown resilience, but also signals a shift towards more measured growth. Buyers who wish to jump in soon may still have a window, before projected values nudge closer to their next milestone.
What should linger in your mind?
With Oldbury’s average prices projected to hit record territory in 2025, getting an offer accepted this season might just feel like winning a golden ticket to Willy Wonka's factory.
There’s a lot to consider when buying, but it starts with seeing what’s available. Check our homes for sale in Oldbury.
The Cost of Homes in Oldbury by Category

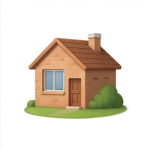
Detached
Avg. Property Price: £312,100
Avg. Size of Property
1,135 sq/ft
Avg. Cost Per Sq/ft
£298 sq/ft
Total transactions
181 (since 2021)

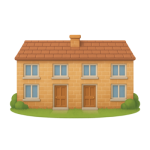
Semi-detached
Avg. Property Price: £221,700
Avg. Size of Property
920 sq/ft
Avg. Cost Per Sq/ft
£246 sq/ft
Total transactions
973 (since 2021)

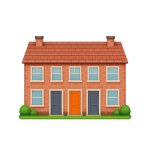
Terraces
Avg. Property Price: £173,700
Avg. Size of Property
859 sq/ft
Avg. Cost Per Sq/ft
£205 sq/ft
Total transactions
738 (since 2021)

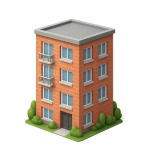
Apartments
Avg. Property Price: £107,300
Avg. Size of Property
625 sq/ft
Avg. Cost Per Sq/ft
£175 sq/ft
Total transactions
83 (since 2021)
At first glance, it’s tempting to say detached homes in Oldbury are only for those with deep pockets. Yet, Oldbury’s market doesn’t bow so easily to this cliché. Detached properties, yes, tend to carry the grandest price tags. But take a closer look, and the tables begin to turn, especially when you scrutinise the cost per square foot and living space they actually offer. Are flats truly the budget-friendly saviours most believe, or are the hidden costs per square foot quietly gouging returns for investors and first-time buyers alike?
The real standouts in Oldbury’s property story are semi-detached homes. Not only are they the busy bees of the market with the largest number of transactions by a country mile, but they also strike a sweet spot between space, cost and future growth. Their continuing popularity is almost understated – much like the quiet rows of Oldbury’s more established neighbourhoods, where families dig in for the long haul. These properties climb in value, slow but steady, making them the unsung heroes for buyers who want both substance and staying power.
Then there’s the terraced option, often pigeonholed as starter homes. Yet, savvy buyers see something more. With a per-square-foot rate just above flats, and clearly far more movement in the market, terraced houses are a springboard for upwardly mobile locals. Even so, with hundreds of transactions in this bracket, it’s not just the dreamers who are cashing in.
As for flats, the numbers suggest an affordable gateway, yet those digging beneath the surface will note their smaller average size and lower capital appreciation potential. If you’re stepping onto the ladder or planning a buy-to-let, ask yourself: does small now mean squeezed later? The answer lies somewhere between the figures and your own personal plans.
At M0VE, we’ve watched local trends evolve through every up and down. Want to understand not just where the deals are but why some streets stay red-hot year after year? Our House Valuation in Oldbury: A Step-by-Step Guide covers the factors most buyers routinely overlook.
What it all means
- Detached homes offer breathing room for those who prize space over price - but the price per square foot isn’t as punishing as city-centre myths insist.
- Semi-detacheds are Oldbury’s reliable workhorses, steadily holding value and keeping families anchored for generations.
- Terraced properties might just be the not-so-secret weapon for buyers who want lively, liquid markets and strong upward mobility.
- Flats still appeal on headline price – but with a pinch of caution on long-term appreciation and liveable space.
District-Level House Prices Across Oldbury
| District | Avg Price (£) | Transactions |
|---|---|---|
| B68 | £195,500 | 2,677 |
| B69 | £179,300 | 2,579 |
Oldbury’s property scene is dancing to its own vibrant rhythm, shaped by the variety and unique feel of its core districts. If you are eyeing up Oldbury for your next move, you will find that the lyrical differences between its postcodes are more than just numbers - they are proof of the area’s evolving story.
Let’s break it down:
- B68 is commanding higher average asking prices, which often hints at greater demand from buyers or perhaps a touch of extra curb appeal. The area’s established homes, mature greenery, and access to amenities keep it very much in the property limelight.
- B69, by contrast, is more accessible pricewise. Here, the market moves quickly - properties have been gathering attention like Aston Villa fans before a local derby. It’s a magnet for buyers wanting value and good connections.
We’ve seen strong transaction numbers in both districts. This means properties are changing hands at a lively pace, with a steady footfall of both movers and investors. B68 seems to draw those hunting for more established homes, while B69’s prices get first-time buyers and young families through the door.
Fancy living in a postcode that’s busier than the queues outside Greggs on a Saturday morning? Both B68 and B69 could fit the bill, but your choice might come down to whether you want established surroundings or a sharper bargain.
So, what are the key takeaway points?
- B68 offers higher average prices and is popular with established buyers seeking mature neighbourhoods.
- B69 draws attention as a value-driven hotspot for energetic movers and younger families.
- Transaction counts are robust in both, making Oldbury’s market feel as lively as a game day at The Hawthorns.
The message for buyers is simple: Oldbury’s districts give you plenty of choice. Whether your heart is set on leafy comfort or you are chasing a canny deal, the property market here is keeping things dynamic and just a little bit unpredictable.
Oldbury Property Prices Compared Across the Region
| City | Avg Price (£) | Transactions |
|---|---|---|
| Rowley Regis | £180,800 | 1,870 |
| Smethwick | £183,600 | 3,238 |
| Cradley Heath | £189,100 | 1,469 |
| Halesowen | £223,200 | 5,632 |
| West Bromwich | £180,200 | 3,716 |
| Tipton | £155,800 | 2,902 |
| Dudley | £184,200 | 7,435 |
| Brierley Hill | £175,200 | 3,132 |
| Wednesbury | £160,500 | 3,077 |
| Bilston | £160,000 | 3,271 |
The property scene around Oldbury is a lively mix of contrasting prices and bustling activity. Oldbury doesn’t exist in a bubble. Buyers here are spoiled for choice, with everything from vibrant, value-focused neighbourhoods to established suburbs practically within arm’s reach. In simple terms, there’s no quiet corner here: the market is humming, and each locale seems to offer its own twist on value.
When you dig beneath the surface, several patterns stand out:
- Price gradient: Surrounding areas reveal a broad spectrum. Halesowen’s average sits notably higher than most, while Tipton, Wednesbury, and Bilston drag prices lower, underpinning their reputation as accessible entry points for buyers who want to stay near the heart of the Black Country without breaking the bank.
- Transaction appetite: A few places, such as Dudley and Halesowen, light up the transaction dashboard. When three towns see over 3,000 property sales, it hints at a region with genuine demand, and where moving up the ladder is more than just pipe dream chatter.
- Pockets of premium: Halesowen stands tall with a distinctly higher average sale price. It’s almost the ‘prized roast at Sunday dinner’ in this selection, showing that buyers are willing to pay extra for a sought-after postcode, perhaps chasing superior amenities or those tidy, tree-lined streets.
- Neighbourhood contrast: The likes of West Bromwich and Rowley Regis match up closely on price, demonstrating that even a short drive can place you in pretty similar affordability brackets. Yet, the character and pace of life may be miles apart-local hearsay will tell you the difference is chalk and cheese.
- Value hunters flocking to Tipton and Wednesbury: With their lower average prices, these towns are obvious magnets for first-time buyers and savvy investors trying to kipper a deal before others catch on. It’s a case of "blink and you’ll miss it," especially with the steady drumbeat of sales.
Comparing all this to Oldbury, it sits square in the mix. Neither the cheapest nor the priciest, but striking a happy balance-attracting a melting pot of buyers wanting good commuting links, varied housing, and frankly, proper West Midlands charm without the hefty premium attached.
So what’s the core message?
Oldbury and its neighbours are locked in close competition, yet each strikes its own tone-some attract with value, others with prestige. For those who truly want the best of both worlds, Oldbury just might offer the goldilocks zone.
Keep in mind, the pricing and transaction figures are based on district-wide averages alone.
No adjustments have been made for home sizes or per square foot value. For deeper insights, head over to our blog. Thanks for reading.
Every Figure Checked. Every Detail Counted.
Our process is calm, measured and focused on fairness. Each property figure is fine-tuned using adjustments that reflect the street, not the stereotype. Explore the thinking behind the tool

