Useful Links
Social
Analysing House Prices in Craven Arms, Shropshire
See how sales of flats, semis, and detached homes have changed each year in Craven Arms, benchmarked against towns in the wider area.
These comparisons help determine if Craven Arms’s housing trends are part of a larger shift or more locally driven.
How much is your Craven Arms home worth?
Get a personalised estimate based on recent local sales and property type.
What Should Properties in Craven Arms Cost?
Property Type Breakdown
How big is the property?
Choose your comparison:
Craven Arms House Prices - Summary
An overview of house prices in Craven Arms since 2022.
House Prices > Craven Arms
| Year | Average Price | Transactions |
|---|---|---|
| 2025 (proj.) | £396,900 | 132 |
| 2024 | £379,700 | 81 |
| 2023 | £380,100 | 108 |
| 2022 | £385,700 | 132 |
| 2021 | £347,200 | 189 |
| 2020 | £324,700 | 125 |
| 2019 | £302,800 | 134 |
| 2018 | £292,600 | 158 |
The property scene in Craven Arms is a proper rollercoaster ride for anyone watching values closely. Think you already know the script - steady rural rise, sleepy stability - but look a touch deeper and the landscape is far more unpredictable. Average prices have shown notable momentum in the past several years, but that forward march has stumbled here and there. Volatility, rather than consistency, seems the town’s signature.
- Surging prices between 2018 and 2022 stand out, with unusual acceleration that flips the myth of snail-paced market towns completely on its head.
- Yet, price dips and plateaus from 2023 to 2024 show Craven Arms isn’t immune to national jitters. The apparent stall flies in the face of those who believe the countryside is always a price haven.
Even so, the projected uptick for 2025 suggests renewed confidence. Buyers waiting on the sidelines might need to act, or risk being left behind. The pattern of transactions is just as unpredictable, swinging from highs to noticeable lows before bouncing again - never the smooth country lane most expect.
So what should we remember? Predictions of perpetual calm in rural property simply don’t add up for Craven Arms. Its market is dynamic and surprising - challenging the idea that small towns never move faster than a Shropshire tractor at rush hour.
Thinking ahead to your next home? Craven Arms has plenty of houses for sale right now.
Craven Arms House Prices Grouped by Property Type

Detached
Avg. Property Price: £434,200
Avg. Size of Property
1,584 sq/ft
Avg. Cost Per Sq/ft
£284 sq/ft
Total transactions
95 (since 2021)

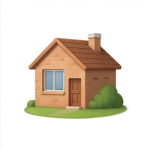
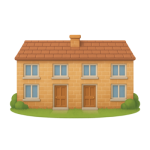
Semi-detached
Avg. Property Price: £259,700
Avg. Size of Property
1,031 sq/ft
Avg. Cost Per Sq/ft
£248 sq/ft
Total transactions
46 (since 2021)

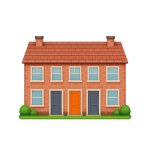
Terraces
Avg. Property Price: £205,900
Avg. Size of Property
979 sq/ft
Avg. Cost Per Sq/ft
£204 sq/ft
Total transactions
35 (since 2021)

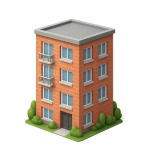
Apartments
Avg. Property Price: £130,000
Avg. Size of Property
887 sq/ft
Avg. Cost Per Sq/ft
£144 sq/ft
Total transactions
5 (since 2021)
Walk down a Craven Arms street and you’ll notice a diverse selection of properties. The numbers reveal a surprisingly vivid split between those seeking extra comfort and those chasing affordability. Detached homes, sitting proud at the higher end, dominate the landscape in both price and size, often boasting gardens roomy enough for a summer barbecue or two. They’re particularly attractive for anyone looking to stretch out, especially with the generous average living area and notable price tag per square foot. Yet, these coveted homes don’t change hands all that frequently. It’s like the Shropshire hills after a summer shower - still and serene, not much movement, which can make the hunt for one feel as competitive as grabbing the last sausage roll at the Thursday market.
For those who crave value and practicality, semi-detached and terraced properties stand out. Their transaction numbers suggest these homes are the real backbone of the Craven Arms market. Sales activity here bubbles along at a healthy pace, especially in the family-sized bracket. These spots offer a sweet balance: enough space for a couple or young family, without prices that sting too badly. That said, cost per square foot in this segment is solid, meaning you’re not paying through the nose for the privilege of a bit more space compared to a flat.
Flats, meanwhile, are almost as rare as a parking space outside the station on a market day. Their transaction count is dramatically lower, hinting at a tight supply. If you’re thinking about a flat purchase here, know you’ll be facing limited availability but won’t have to empty your piggy bank. Flats bring the lowest average price and the lowest cost per square foot, making them ideal for downsizers, young professionals or anyone eyeing a manageable first step onto the ladder.
- Detached homes are spacious and prestigious, but see less market action - waiting for a new listing can feel almost glacial.
- Semi-detached and terraced homes drive the market forward, offering a compelling mixture of value and move-in potential.
- Flats, though budget-friendly, trade hands infrequently - patience is your best mate in this part of town.
Want an accurate sense of your home’s true value? Take a closer look: Discover Your Home’s True Worth in Craven Arms.
So, what should we remember?
- The most desirable properties are often more elusive than you’d expect, especially detached homes.
- Semi-detached and terraces offer both value and activity - a good match for many buyers.
- If you’re flat-hunting, keep an eye out and be ready to move quickly when opportunity knocks.
Craven Arms House Prices vs the West Midlands Area
| City | Avg Price (£) | Transactions |
|---|---|---|
| Church Stretton | £358,500 | 569 |
| Ludlow | £273,600 | 1,646 |
| Leominster | £260,300 | 1,522 |
| Newtown | £188,100 | 998 |
| Bridgnorth | £272,300 | 1,952 |
| Shrewsbury | £267,700 | 11,847 |
| Welshpool | £219,200 | 841 |
| Bromyard | £259,000 | 608 |
| Bewdley | £302,900 | 893 |
| Telford | £187,900 | 10,468 |
If you’re looking at the housing scene in Craven Arms compared to its neighbours, things feel very much in motion. Some streets here are starting to get hotter than a last-minute Glastonbury ticket, but step outside the borders and you’ll find wildly different stories unfolding.
High-value postcodes like Church Stretton create a noticeable ripple, drawing in buyers chasing that picturesque Shropshire backdrop-though, with prices sky-high, it’s not a move for the faint-hearted. By contrast, places just down the road, including Newtown and Welshpool, offer homes at prices that seem to belong to another world entirely.
We’ve observed that transaction numbers are equally unpredictable. Shrewsbury and Telford, with their bustling urban buzz, move homes at a seriously rapid clip. If you’re craving busy streets and local action, these towns pack far more market movement. Thousands of transactions keep things lively and competitive, especially for families and commuters who want it all-space, connection, and a constant sense of change.
- Upscale retreats like Church Stretton and Bewdley demand a premium, which means slower turnover and fewer young buyers muscling in.
- Mid-market hubs including Ludlow, Leominster, and Bridgnorth strike a balance-offering distinctive town vibes and a comfortable price range for most buyers.
- Wallet-friendly spots such as Newtown and Telford push affordability to the front, often drawing in first-time buyers and long-term locals unwilling to pay the “prettiest village” surcharge.
If you’re weighing up a decision, Craven Arms finds itself caught between two worlds. Locals stick around for the practical life, while fresh arrivals come for value that’s harder to sniff out elsewhere. It’s a market growing more unpredictable by the month-flip a coin today, and the next year could look completely different.
So, what are the key takeaway points?
- Craven Arms is morphing: Expect more growth and competition as the rest of the region gets pricier.
- Neighbouring towns' pricing is extreme: There’s colossal contrast between the luxury enclaves and pragmatic commuter hubs.
- Buyers have options: Whether you want peaceful corners, city proximity, or countryside charm, there’s still something for every taste and budget.
In many ways, choosing a home in Craven Arms is like picking your favourite spot at a festival-the vibe, the price, and the crowd are always shifting. If you’re ready to take a punt, this could be your moment.
Kindly keep in mind, these figures highlight general pricing averages and sales volumes only.
This data leaves out property sizes and square foot costs, so full trends might not be visible. See more detail at our blog. Thank you.
Real Data. Real Intelligence.
Your street deserves accuracy, not approximation. We update each figure to reflect structure, layout, and the local market mood.

