Useful Links
Social
The Latest on B13 House Prices
Examine how transactions in B13 have evolved since 2018, segmented by housing type and compared with neighbouring locations.
You’ll also discover where steady growth has continued - and where the pace has started to cool off.
How much is your Birmingham home worth?
Get a personalised estimate based on recent local sales and property type.
What Should Properties in Birmingham Cost?
Property Type Breakdown
How big is the property?
Choose your comparison:
Birmingham House Prices - Summary
An overview of house prices in Birmingham since 2022.
House Prices > Birmingham > B13
| Year | Average Price | Transactions |
|---|---|---|
| 2025 (proj.) | £309,200 | 451 |
| 2024 | £299,000 | 352 |
| 2023 | £305,500 | 352 |
| 2022 | £283,900 | 479 |
| 2021 | £298,200 | 577 |
| 2020 | £272,800 | 398 |
| 2019 | £257,000 | 522 |
| 2018 | £246,200 | 479 |
The B13 postcode in Birmingham has put on quite a show over the last few years, with house prices rippling out like concentric rings in a city-centre coffee cup. We’ve watched lovely red brick terraces here climb and dip in value, echoing the unpredictable British weather: up one moment, cooling off the next, then surging again, especially around 2021’s property rush. You can almost hear the rustle of for-sale boards changing hands faster than a Birmingham football derby ticket.
- Pricing trends feel anything but flat. We’ve seen peaks that glimmer with promise for sellers, with 2021 standing out - a year that felt as lively as a Saturday on Moseley’s High Street. Stretched budgets and shifting demand saw prices swing, sometimes soothing, sometimes startling buyers.
- Transaction numbers have danced to their own beat, at times brisk and buoyant, at others slower and more cautious. The quieter years ring with a sense of hesitation, no doubt shaped by outside pressures - think pandemic uncertainties or shifting mortgage rates.
If you’re dreaming of a spot in leafy B13, timing and patience are your new best friends. At M0VE, we’ve noticed that family homes here are still snapped up quickly when priced right – no matter if the market is as hot as a curry from the Balti Triangle or gently cooling like a canal at dusk.
So, what should we remember?
Even with the city’s soundtrack changing, B13’s property appeal holds strong, with each year adding its own distinctive note to this vibrant Birmingham neighbourhood.
Average House Prices Across B13 by Home Type

Detached
Avg. Property Price: £526K
Avg. Size of Property
1,584 sq/ft
Avg. Cost Per Sq/ft
£344 sq/ft
Total transactions
139 (since 2021)

Semi-detached
Avg. Property Price: £354K
Avg. Size of Property
1,238 sq/ft
Avg. Cost Per Sq/ft
£296 sq/ft
Total transactions
267 (since 2021)

Terraces
Avg. Property Price: £227K
Avg. Size of Property
860 sq/ft
Avg. Cost Per Sq/ft
£264 sq/ft
Total transactions
579 (since 2021)

Apartments
Avg. Property Price: £154K
Avg. Size of Property
664 sq/ft
Avg. Cost Per Sq/ft
£237 sq/ft
Total transactions
189 (since 2021)
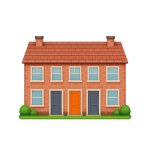
The property market in B13 has been running faster than a cappuccino machine on a Saturday morning, especially for terraced and semi-detached homes. These two types have notched up the lion’s share of recent transactions, revealing a clear preference for that sweet spot between space and affordability. Terraced houses saw bustling activity, with the volume of deals pushing ahead of all other property types. That’s hardly surprising; their typical size and competitive cost per square foot tick all the boxes for both first-time buyers and landlords wanting flexible investments.
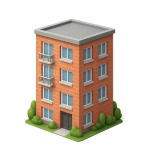
Then there’s the story higher up the market. Detached homes in B13 remain rare, but they pack a punch when it comes to spaciousness and price. Think of them as the gentle giants of the area: less likely to come up, but impressive when they do. Flats, by contrast, sit at the accessible end of the spectrum, offering the lowest point of entry, and appealing to those with minimalist aspirations or who prioritise urban convenience over a sprawling living room.
With that said, the gap in cost per square foot between property types isn’t as dramatic as you may expect. Semi-detached homes stand out for delivering roomy layouts, but without a wallet-wilting premium per foot. That means buyers who want to balance living space and overall spend won’t be left out in the cold.
See the latest B13 buying trends and tips here.
So, what are the key takeaway points?
- Terraced and semi-detached properties offer the most dynamic market with rapid turnover and accessible pricing.
- Detached homes deliver maximum space and standout value per square foot for those seeking something special in B13.
- Flats are the entry-level ace for minimalist buyers, but most of the action stays with houses.
From Official Records to Real Insights
Each estimate on our platform starts with reliable records, then travels through a custom correction process that brings more fairness and precision to street-by-street values. Check out our data method
All Roads in B13 – Birmingham
| Road Name | No. of Postcodes | Postcode 1 | Postcode 2 | Postcode 3 |
|---|---|---|---|---|
| Admiral Place | 1 | B13 8BQ | ||
| Alcester Road | 192 | B13 8AP | B13 8AR | B13 8BA |
| Aldwyn Avenue | 1 | B13 8HB | ||
| Amesbury Road | 2 | B13 8LD | B13 8LE | |
| Anderton Park Road | 14 | B13 9BG | B13 9BJ | B13 9BQ |
| April Croft | 1 | B13 9HP | ||
| Ardencote Road | 2 | B13 0RN | B13 0RW | |
| Ascot Road | 2 | B13 9EL | B13 9EN | |
| Ashdown Close | 4 | B13 9ST | B45 0DJ | B13 9ST |
| Ashleigh Grove | 1 | B13 9JR | ||
| Astor Drive | 1 | B13 9QR | ||
| Augusta Road | 4 | B13 8AE | B27 6LA | B13 8AE |
| Augusta Road East | 1 | B13 8AJ | ||
| Avon Drive | 6 | B13 9PS | B36 0TR | B47 6JA |
| Bagnell Road | 1 | B13 0SJ | ||
| Bankside | 6 | B13 9LU | B43 5PN | B43 5PR |
| Barn Lane | 2 | B13 0SN | B13 0SW | |
| Beauchamp Road | 6 | B13 0NL | B13 0NN | B13 0NP |
| Belle Walk | 3 | B13 9DB | B13 9DE | B13 9DF |
| Berkley Crescent | 1 | B13 9YD | ||
| Bibsworth Avenue | 1 | B13 0BA | ||
| Billesley Lane | 26 | B13 9QS | B13 9QT | B13 9QU |
| Binton Croft | 1 | B13 9RS | ||
| Birdwell Croft | 1 | B13 0SD | ||
| Blenheim Road | 3 | B13 9TY | B13 9TZ | B13 9UA |
| Bloomfield Road | 2 | B13 9BY | B13 9BZ | |
| Bondfield Road | 1 | B13 0JA | ||
| Boundary Drive | 1 | B13 8NY | ||
| Bourne Close | 1 | B13 0HA | ||
| Braceby Avenue | 4 | B13 0UP | B13 0UR | B13 0US |
| Bradnock Close | 1 | B13 0DL | ||
| Brigfield Crescent | 1 | B13 0JP | ||
| Brigfield Road | 1 | B13 0JG | ||
| Britannic Gardens | 1 | B13 8QX | ||
| Bromwall Road | 3 | B13 0LG | B13 0LQ | B13 0LS |
| Brook Lane | 30 | B13 0AA | B13 0AB | B13 0BP |
| Brookside Avenue | 1 | B13 0TJ | ||
| Burke Avenue | 1 | B13 9XB | ||
| Cadbury Road | 1 | B13 9BH | ||
| Cadine Gardens | 1 | B13 8QN | ||
| Cambridge Road | 3 | B13 9UD | B13 9UE | B13 9UG |
| Capcroft Road | 1 | B13 0JB | ||
| Caroline Road | 1 | B13 8AL | ||
| Chamberlain Road | 3 | B13 0QA | B13 0QB | B13 0QP |
| Chandos Avenue | 1 | B13 8HG | ||
| Chantry Road | 12 | B13 8DH | B13 8DJ | B13 8DL |
| Charlecott Close | 1 | B13 0DE | ||
| Chells Grove | 1 | B13 0NA | ||
| Chessetts Grove | 1 | B13 0RG | ||
| Chesterwood Road | 5 | B13 0QD | B13 0QE | B13 0QF |
| Chestnut Road | 2 | B13 9AH | B13 9AJ | |
| Chinn Brook Road | 7 | B13 0LU | B13 0LX | B13 0LY |
| Church Grove | 6 | B13 0NH | B13 0NJ | B20 3TP |
| Coldbath Road | 4 | B13 0AE | B13 0AG | B13 0AH |
| Cole Bank Road | 6 | B13 0BG | B28 8EU | B28 8EX |
| Colebourne Road | 4 | B13 0EX | B13 0EY | B13 0EZ |
| Colemeadow Road | 12 | B13 0JH | B13 0JJ | B13 0JL |
| College Road | 264 | B13 9LH | B13 9LJ | B13 9LP |
| Coppice Road | 1 | B13 9DP | ||
| Cornerstone | 1 | B13 8EN | ||
| Cotton Lane | 3 | B13 9SA | B13 9SB | B13 9SE |
| Dads Lane | 3 | B13 8PG | B13 8PQ | B13 8PW |
| Dane Grove | 1 | B13 8PP | ||
| Dene Hollow | 2 | B13 0EG | B13 0EL | |
| Dovey Road | 2 | B13 9NS | B13 9NT | |
| Dyott Road | 2 | B13 9QY | B13 9QZ | |
| Eastham Road | 2 | B13 0JX | B13 0JY | |
| Eastlands Road | 1 | B13 9RG | ||
| Effingham Road | 2 | B13 0DN | B13 0DW | |
| Elizabeth Road | 3 | B13 8QH | B13 8QJ | B33 8AS |
| Ellerslie Road | 1 | B13 0DP | ||
| Elm Bank | 1 | B13 9FF | ||
| Elmfield Crescent | 2 | B13 9TL | B13 9TN | |
| Farquhar Road | 12 | B13 8HH | B15 2QJ | B15 2QP |
| Forest Road | 6 | B13 9DH | B13 9DL | B25 8LJ |
| Glen Rise | 2 | B13 0EH | B13 0EJ | |
| Goodby Road | 6 | B13 8NJ | B13 8RH | B13 8RJ |
| Grayfield Avenue | 1 | B13 9AD | ||
| Green Road | 12 | B13 9XA | B13 9XE | B28 8BZ |
| Greenend Road | 1 | B13 9TJ | ||
| Greenhill Road | 14 | B13 9SR | B13 9SS | B13 9SU |
| Greenstead Road | 1 | B13 9NG | ||
| Grove Avenue | 18 | B13 9RU | B13 9RX | B13 9RY |
| Hallstead Road | 1 | B13 0NT | ||
| Harlequin Drive | 1 | B13 8NU | ||
| Hartswell Drive | 1 | B13 0PE | ||
| Haunch Close | 1 | B13 0PZ | ||
| Haunch Lane | 10 | B13 0NX | B13 0PA | B13 0PJ |
| Hawthorne Gardens | 1 | B13 0BE | ||
| Hayfield Road | 3 | B13 9LF | B13 9LG | B13 9LQ |
| Heather Dale | 1 | B13 8NN | ||
| Heythrop Grove | 1 | B13 0AU | ||
| Highfield Road | 195 | B13 9HL | B13 9HN | B13 9HR |
| Hill Crest Road | 1 | B13 8EX | ||
| Holders Gardens | 1 | B13 8NW | ||
| Holders Lane | 1 | B13 8NL | ||
| Hollie Lucas Road | 4 | B13 0QH | B13 0QJ | B13 0QL |
| Hollybank Road | 13 | B13 0QU | B13 0QX | B13 0QY |
| Hopton Grove | 2 | B13 0LH | B13 0LJ | |
| Howard Road East | 2 | B13 0RQ | B13 0RY | |
| Hullbrook Road | 4 | B13 0JU | B13 0LA | B13 0LD |
| Jutland Road | 2 | B13 0TX | B13 0TY | |
| King Edward Road | 1 | B13 8HR | ||
| Kingswood Road | 18 | B13 9AL | B13 9AN | B13 9AP |
| Knutswood Close | 1 | B13 0EN | ||
| Laburnum Grove | 1 | B13 8EL | ||
| Leighton Road | 1 | B13 8HD | ||
| Leylan Croft | 1 | B13 0DB | ||
| Linkswood Close | 1 | B13 9LA | ||
| Louise Lorne Road | 1 | B13 8BN | ||
| Mallory Rise | 1 | B13 9YE | ||
| Malton Grove | 1 | B13 0TH | ||
| Manor Park Close | 1 | B13 9SL | ||
| Maple Croft | 1 | B13 0PF | ||
| Mapperley Gardens | 1 | B13 8RN | ||
| Marlcliff Grove | 1 | B13 0RP | ||
| Mayford Grove | 1 | B13 0HJ | ||
| Meadow View | 1 | B13 0AP | ||
| Menin Road | 2 | B13 0TT | B13 0TU | |
| Merton Road | 1 | B13 9BX | ||
| Michelle Close | 1 | B13 0PR | ||
| Millbrook Gardens | 1 | B13 0AD | ||
| Milner Way | 1 | B13 0BB | ||
| Moor Green Gardens | 1 | B13 8QU | ||
| Moor Green Lane | 9 | B13 8JN | B13 8NB | B13 8NE |
| Moorcroft Road | 4 | B13 8LS | B13 8LT | B13 8LU |
| Moseley Gate | 1 | B13 8JJ | ||
| Mulberry Drive | 1 | B13 9PL | ||
| Norley Grove | 1 | B13 0DR | ||
| Northlands Road | 1 | B13 9RE | ||
| Oak Leaf Drive | 1 | B13 9FE | ||
| Oakcroft Road | 2 | B13 0HP | B13 0HR | |
| Oakhurst Drive | 1 | B13 9DR | ||
| Oakland Road | 6 | B13 9DN | B21 0NA | B21 9QT |
| Oxford Road | 36 | B13 9EH | B13 9EJ | B13 9ER |
| Pagnell Grove | 1 | B13 0HH | ||
| Park Hill | 4 | B13 8DR | B13 8DS | B13 8DT |
| Passey Road | 2 | B13 9NR | B13 9NU | |
| Paton Grove | 1 | B13 9TG | ||
| Peacock Road | 2 | B13 0NY | B13 0NZ | |
| Pensby Close | 1 | B13 9QJ | ||
| Penshaw Grove | 1 | B13 9NL | ||
| Pickwick Grove | 2 | B13 9LL | B13 9LN | |
| Picton Grove | 2 | B13 0LP | B13 0LR | |
| Pool Meadow Close | 1 | B13 9YP | ||
| Portman Road | 2 | B13 0SH | B13 0SL | |
| Poulton Close | 1 | B13 9SD | ||
| Prospect Road | 2 | B13 9TB | B13 9TD | |
| Purefoy Road | 2 | B13 0NG | B13 0NQ | |
| Queenswood Road | 2 | B13 9AU | B13 9AX | |
| Reddings Road | 4 | B13 8LN | B13 8LP | B13 8LR |
| Redford Close | 1 | B13 9YX | ||
| Ridge Close | 1 | B13 0EA | ||
| Ritchie Close | 1 | B13 9TA | ||
| Russell Road | 24 | B13 8NH | B13 8RA | B13 8RB |
| Salisbury Close | 1 | B13 8JX | ||
| Salisbury Road | 33 | B13 8JS | B13 8JT | B13 8JU |
| Sandford Road | 6 | B13 9BP | B13 9BS | B13 9BT |
| Sandhurst Road | 2 | B13 8ET | B13 8EU | |
| Sandway Grove | 1 | B13 0HU | ||
| Sandy Croft | 1 | B13 0EP | ||
| Sarehole Mill Gardens | 1 | B13 8BP | ||
| School Road | 120 | B13 9ET | B13 9SN | B13 9SP |
| Seaton Grove | 1 | B13 8PD | ||
| Selborne Grove | 1 | B13 0LB | ||
| Selby Grove | 2 | B13 0LL | B13 0LN | |
| Shelsley Drive | 1 | B13 9JU | ||
| Shutlock Lane | 1 | B13 8NZ | ||
| Silverton Crescent | 1 | B13 9NH | ||
| Southlands Road | 2 | B13 9RJ | B13 9RL | |
| Sovereign Way | 1 | B13 8AT | ||
| Springfield Road | 51 | B13 9ND | B13 9NE | B13 9NF |
| St Agnes Close | 1 | B13 9NZ | ||
| St Agnes Road | 6 | B13 9PH | B13 9PJ | B13 9PN |
| St Albans Road | 2 | B13 9AR | B13 9AS | |
| St Annes Court | 1 | B13 8DX | ||
| St Johns Close | 1 | B13 8AW | ||
| St Marys Row | 5 | B13 8HW | B13 8JG | B13 9EF |
| Stacey Drive | 1 | B13 0QT | ||
| Stanley Place | 1 | B13 8JH | ||
| Strensham Hill | 1 | B13 8AG | ||
| Sutherland Drive | 1 | B13 8AY | ||
| Swanshurst Lane | 6 | B13 0AJ | B13 0AL | B13 0AN |
| Taylor Road | 4 | B13 0PB | B13 0PG | B13 0PH |
| Tenby Road | 4 | B13 9LT | B13 9LX | B13 9LY |
| The Hawthorns | 1 | B13 9DY | ||
| The Hurst | 8 | B13 0DA | B13 0DD | B13 0DG |
| The Russells | 1 | B13 8RT | ||
| Thirlmere Drive | 4 | B13 9QH | B13 9QL | B13 9QN |
| Thornley Close | 1 | B13 9UQ | ||
| Tilbury Grove | 1 | B13 8PE | ||
| Torridon Croft | 1 | B13 8RG | ||
| Towyn Road | 1 | B13 9NA | ||
| Trittiford Road | 4 | B13 0ES | B13 0ET | B13 0HD |
| Tudor Close | 4 | B13 0PD | B14 4TL | B13 0PD |
| Tudor Road | 1 | B13 8HA | ||
| Twickenham Drive | 1 | B13 8LY | ||
| Vimy Road | 2 | B13 0UA | B13 0UB | |
| Wake Green Park | 15 | B13 9XN | B13 9XP | B13 9XR |
| Wake Green Road | 64 | B13 0BH | B13 0BJ | B13 0BL |
| Warren Avenue | 1 | B13 8HE | ||
| Warwick Court | 1 | B13 9HF | ||
| Wellesley Gardens | 2 | B13 9YY | B13 9YZ | |
| Westlands Road | 1 | B13 9RH | ||
| Westridge Road | 6 | B13 0DT | B13 0DU | B13 0DZ |
| Wheelers Lane | 9 | B13 0SA | B13 0SB | B13 0SE |
| Willersey Road | 2 | B13 0AX | B13 0AY | |
| Windermere Road | 8 | B13 9JP | B13 9JS | B21 9RG |
| Wold Walk | 2 | B13 0JS | B13 0JT | |
| Woodbridge Road | 2 | B13 8EH | B13 8EJ | |
| Woodnorton Drive | 1 | B13 8QA | ||
| Woodrough Drive | 1 | B13 9EP | ||
| Woodstock Road | 16 | B13 9BA | B13 9BB | B13 9BD |
| Wroxall Grove | 1 | B13 0RS | ||
| Yardley Wood Road | 78 | B13 0HN | B13 0HW | B13 0HX |
| Yew Tree Road | 18 | B13 8NF | B13 8NQ | B15 2LX |

