Clean Data, Clear Thinking
Each estimate is crafted using corrected figures drawn from real sales and energy reports. You get more truth, less padding. Get the inside story
Learn how Walnut Drive in Cannock compares to the broader area and the wider Cannock region with this detailed page.
While you're here, see what you can uncover with these features.
How much is your home worth?
Get a personalised estimate based on recent local sales and property type.
Why Use M0VE?
Spot undervalued deals in any given area
Find the perfect home that matches your budget and lifestyle
Relocate smarter with side-by-side area comparisons
Take the guesswork out of making an offer
Access the UK's most accurate valuation tool
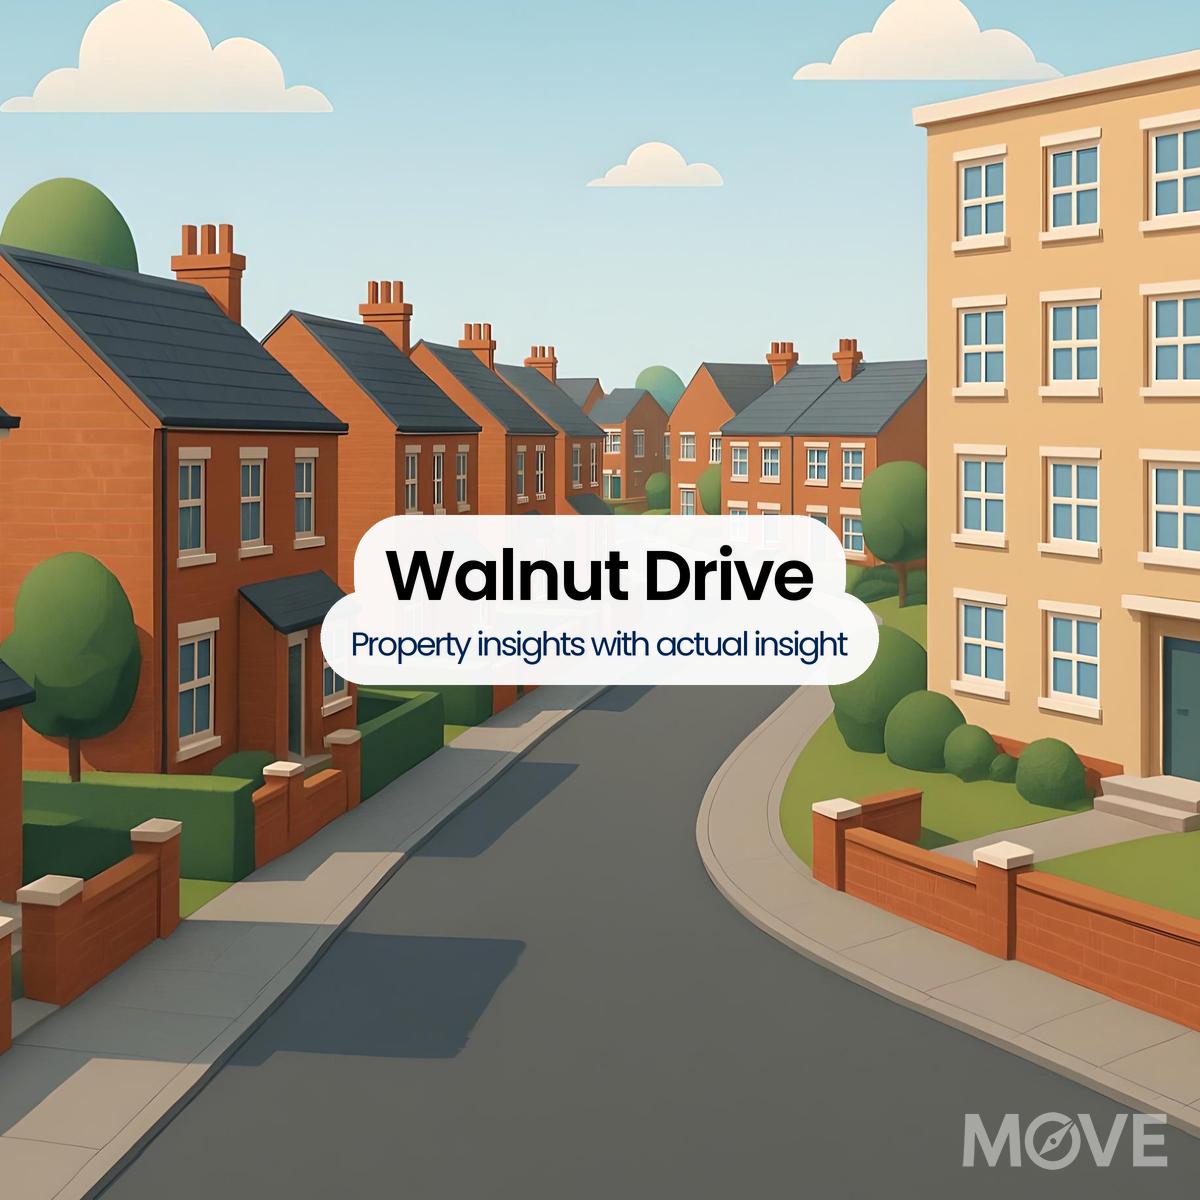
Get in-depth stats for any street in the UK
Visualise UK market data with interactive charts
Get smarter alerts that go way beyond new listings
Chat with AI trained on real property data
House Prices > Cannock > WS11 > Walnut Drive
Quick Look at Property Prices in Walnut Drive
Property Costs: Walnut Drive vs Surrounding Areas
WS11 6
Latest figures reveal Walnut Drive properties carry an average saving of 5% compared to the wider sector. (£176,200 vs £168,100). Buyers picking Walnut Drive over other sector locations could pocket approximately £8,100.
i.e. WS11
Stretch goals? Affording the WS11 district might take around 25% more than Walnut Drive. (£210,200 vs £168,100). From a cost-efficiency angle, homes on Walnut Drive could deliver a saving of around £42,100.
i.e. Cannock
Properties on Walnut Drive sit at a 39% discount compared to those in Cannock. (£168,100 vs £233,000). With this difference, a home on Walnut Drive could be priced around £65,200 less than a comparable one in Cannock.
WS11 at a Glance
Each estimate is crafted using corrected figures drawn from real sales and energy reports. You get more truth, less padding. Get the inside story
×
Our site uses cookies. By using this site, you agree to the Privacy Policy and Terms of Use.