Molesworth Avenue, CV3 House Prices - 2025 Data & Insights

Look into the pricing patterns for Molesworth Avenue in the CV3 district in Coventry, and see how they differ across Coventry.

While you’re here, make sure to try these tools:

Associated Postcodes: CV3 1BU

What’s the real cost of properties on Molesworth Avenue?

How big is the property?

1000 sq/ft

Type of property?

Is it a new-build property?

Estimated Value:
£350,060

Certainty: 7 out of 10

Why Use M0VE?

Property Discovery
Find hottest properties - flame icon with trending house
Find Hottest Properties

Spot undervalued deals in any given area

Dream property finder - house with heart and search magnifying glass
Dream Property Finder

Find the perfect home that matches your budget and lifestyle

Relocation adviser - moving truck with location pin marker
Relocation Adviser

Relocate smarter with side-by-side area comparisons

Smart Decision Tools +
Property negotiator - handshake with dollar sign for deal making
Property Negotiator

Take the guesswork out of making an offer

Property valuation - house with price tag and calculator
Property Valuation

Access the UK's most accurate valuation tool

Street level data - map with data points and location markers
Street Level Data

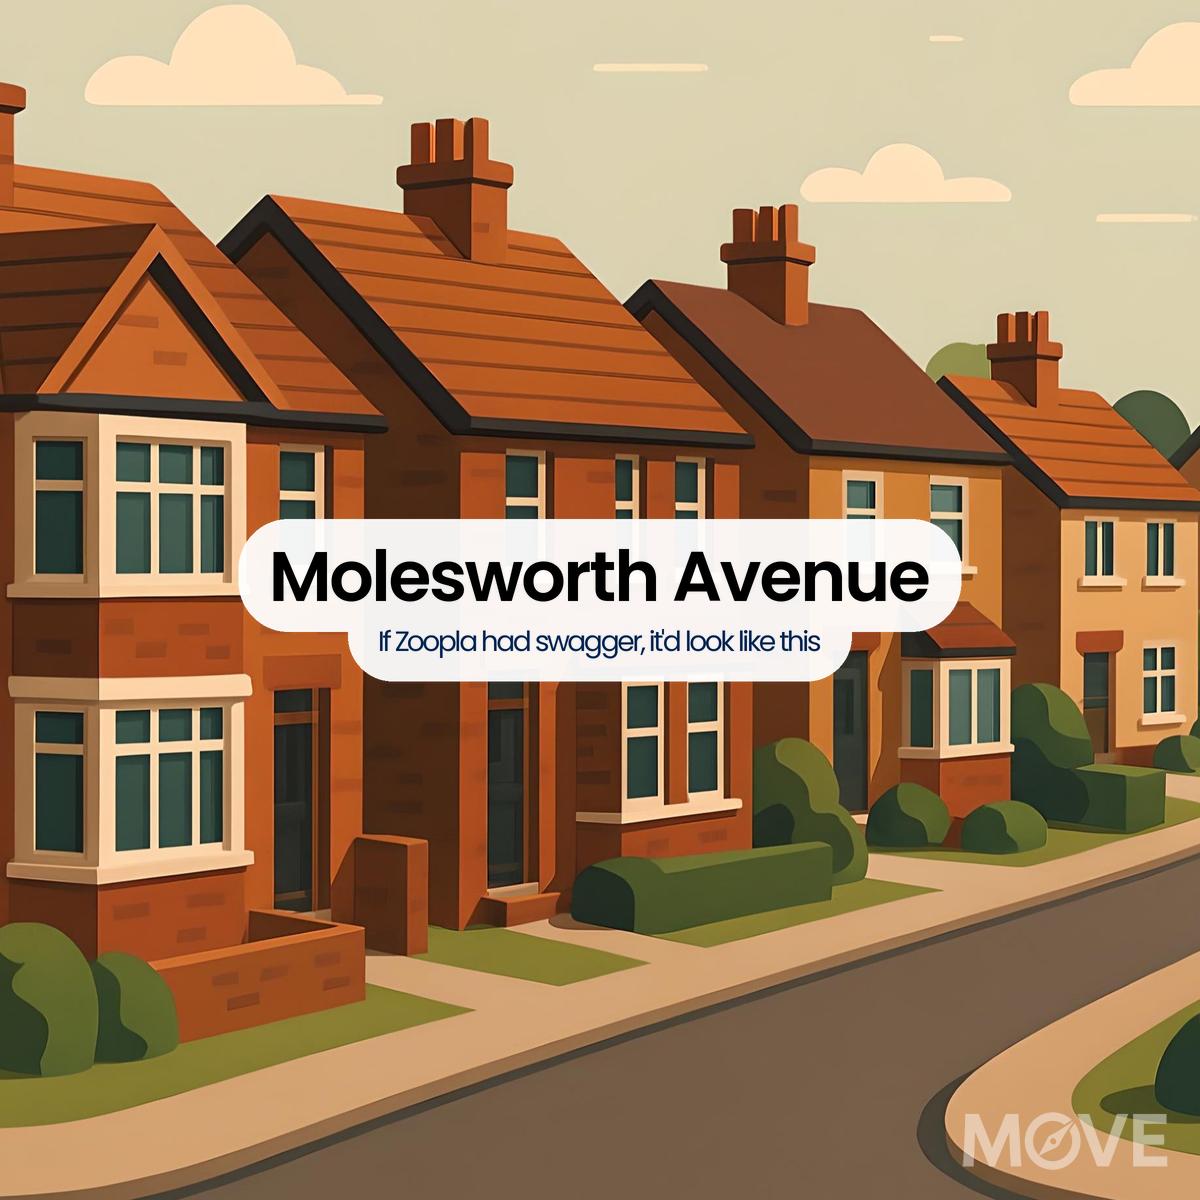
Get in-depth stats for any street in the UK

Next-Gen Tech Features +
Data visualisation - interactive charts and graphs with analytics
Data Visualisation

Visualise UK market data with interactive charts

Smart alerts system - notification bell with property alert badges
Smart Alerts System

Get smarter alerts that go way beyond new listings

AI chat assistant - chatbot with speech bubble and artificial intelligence brain
AI Chat Assistant

Chat with AI trained on real property data

Unlock the UK property market with M0VE.com! Get accurate valuations, top deals, local insights, and trends to make informed property decisions.
Follow Us
House Prices   >   Coventry  >   CV3  >  Molesworth Avenue
Street’s Market Snapshot

House Price Insights for Molesworth Avenue

  • Since 2021, Molesworth Avenue has seen 11 transactions, with houses selling for an average of £186,800. The average size of these properties is 950 square feet, translating to £190 per square foot.
  • Since 2021, Molesworth Avenue homes have pirouetted between £147,000 and £221,000, with square foot prices gliding from £150 to £233.
  • The latest property sale on Molesworth Avenue was finalised in October 2024.
Road Prices in Perspective

Molesworth Avenue’s Market vs Surrounding Areas

By Sector

CV3 1

Street by street, Molesworth Avenue comes out roughly 14% less expensive than its sector peers. (£213,600 vs £186,800). Based on these insights, a home on Molesworth Avenue might come in at £26,800 less than a similar one in the sector.

By District

i.e. CV3

Property prices in Molesworth Avenue are 30% lower on average compared to the CV3 district. (£186,800 vs £242,000). Based on these figures, purchasing a like-for-like home on Molesworth Avenue instead of another street in the same district could result in savings of £55,200.

By City or Town

i.e. Coventry

Coventry properties carry a 58% premium over those in Molesworth Avenue. (£295,000 vs £186,800). Thus, Molesworth Avenue stands out as a value-driven choice, potentially saving buyers around £108,300 when compared to Coventry.

What Makes This Street Unique

What Else Can We Learn About Molesworth Avenue?

  • This road is comprised of 33 properties, sharing a single postcode.
  • According to all available data, no new-build properties are present on Molesworth Avenue.
  • Most homes on Molesworth Avenue currently report a score of 61 (D), with upgrade forecasts suggesting 82 (B) is possible.
  • Floor plans on Molesworth Avenue tend to average 950 square feet, offering 7% more space than homes across Coventry.
  • Properties here are resold more frequently – every 8 months – while most CV3 roads take closer to 7.66 months.
City Living Insights

Buying or Selling in Coventry? Read This First

Sometimes the best postcodes aren’t the poshest. These compact reads shine a light on unexpected winners, oddly hot streets, and roads with a bit more bite.
Additionally, we’ve summarised the key market patterns on the House Prices in Coventry page, using simple visuals and digestible numbers.
Top Picks for Exploration

Discover the CV3 Area

You could scroll endlessly through property portals or let us summarise CV3 for you in one tidy, slightly entertaining section – your choice, but we know which is easier.

595

No. of Roads

6,680

No. of Transactions

300K

Avg. Property Price

946

per sq/ft

Avg. Property Size

254

per sq/ft

Avg. Cost Per Sq/Ft

Local Gems to Roam

Additional Streets to Wander

Real Data. Real Intelligence.

We’ve created something that sits between data science and local knowledge. With intelligent adjustments to EPC and Land Registry inputs, we reveal pricing that’s fairer and more useful. Take a closer look at our method
Scroll

Our site uses cookies. By using this site, you agree to the Privacy Policy and Terms of Use.

Please Signup
Please Signup
    Strength: Very Weak
     
    Please Login