Useful Links
Social
House Prices in Lydbury North, Shropshire: What You Need to Know
See how Lydbury North’s housing segments have shifted each year since 2018, with comparisons from nearby markets for balance.
You’ll also learn where Lydbury North is showing early signs of sustained recovery or outperforming expectations.
How much is your Lydbury North home worth?
Get a personalised estimate based on recent local sales and property type.
What Should Properties in Lydbury North Cost?
Property Type Breakdown
How big is the property?
Choose your comparison:
Lydbury North House Prices - Summary
An overview of house prices in Lydbury North since 2022.
House Prices > Lydbury North
| Year | Average Price | Transactions |
|---|---|---|
| 2025 (proj.) | £360,000 | 7 |
| 2024 | £364,600 | 4 |
| 2023 | £375,000 | 3 |
| 2022 | £424,800 | 7 |
| 2021 | £380,900 | 16 |
| 2020 | £355,800 | 6 |
| 2019 | £350,000 | 6 |
| 2018 | £403,600 | 8 |
Lydbury North’s property market tells a story of shifting tides, not unlike a local lane winding around unpredictable hillsides. Prices bobbed and weaved from 2018 through 2025, showing anything but a linear journey. Even so, the village has managed to hold onto its understated charm and desirability through this period.
- 2019’s dip stands out, but didn’t last. Locals recall that year brought fewer transactions, and the rare home that did hit the market could often be snapped up quietly by word-of-mouth long before an online listing appeared.
- By 2021, the activity spiked like the queues outside the Six Bells on quiz night, with 16 properties changing hands. That’s an unusually busy year for a village where homes are tightly held and neighbours rarely budge.
- Average prices remained volatile, peaking in 2022, then easing off. This ebb and flow reflects a market where a single exceptional sale can noticeably tilt the averages, especially with such low annual transaction numbers.
- 2023 and 2024 saw a slower pulse, with just a handful of sales each year. For those priced out of county towns like Ludlow, Lydbury North’s outskirts still offer a calm harbour away from the storm, though patient buyers know to wait for the right opening.
Curiously, the projected data for 2025 hints at continued steadiness in pricing despite a modest uptick in transactions. This blend of rarity and subtle appeal is what gives the Lydbury North market its idiosyncratic rhythm.
One thing remains clear: scarcity here drives both values and local pride. In Lydbury North, homes don’t just swap hands quietly, they exchange stories, histories, and the promise of Sunday afternoons with views rolling out towards the Shropshire hills.
Need something modern? Maybe something traditional? You’ll find both in our homes for sale in Lydbury North.
House Prices in Lydbury North: Detached, Semi, Terrace and Flats

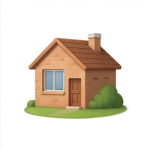
Detached
Avg. Property Price: £375,800
Avg. Size of Property
1,443 sq/ft
Avg. Cost Per Sq/ft
£262 sq/ft
Total transactions
12 (since 2021)

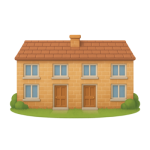
Semi-detached
Avg. Property Price: £337,800
Avg. Size of Property
1,020 sq/ft
Avg. Cost Per Sq/ft
£349 sq/ft
Total transactions
4 (since 2021)

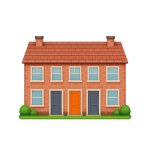
Terraces
Avg. Property Price: £138,400
Avg. Size of Property
688 sq/ft
Avg. Cost Per Sq/ft
£198 sq/ft
Total transactions
5 (since 2021)

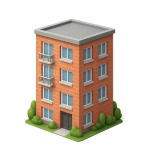
Apartments
Avg. Property Price: £110,000
Avg. Size of Property
603 sq/ft
Avg. Cost Per Sq/ft
£182 sq/ft
Total transactions
1 (since 2021)
Lydbury North’s property prices have been bouncing around like a rubber ball in a small room, though not quite veering off the deep end. Detached and semi-detached homes dominate the village market, each with its own surprisingly peculiar financial quirks. If you are picturing rolling Shropshire hills and sturdy stone fences, you are not far off. Yet under the rustic charm, the figures tell a more competitive story.
Detached homes, often seen as the gold standard for space and privacy in rural pockets like Lydbury North, offer the most breathing room by a country mile. The average size certainly outstrips the typical semi, giving families and anyone hoping to finally store their bicycles inside a clear reason to gravitate that way. Even so, the cost per square foot remains less volatile than a spring sheepdog - startling for an area where premium land is the name of the game. Why? Well, in Lydbury North, you get more space without watching your wallet vaporise, a rare treat in the British countryside.
Semi-detached options pack their own curious punch. Here, buyers trade away that extra garden patch, only to discover they are paying a distinctly higher cost per square foot for the pleasure of slightly less space. This market quirk could be seen as peculiar as an unexpected downpour on a sunny July, but it points to real, underlying demand. Fewer sales, but not for want of interest - perhaps there simply aren't enough semis to keep up with the appetite, or owners are clinging on as tightly as locals grip their umbrellas in a February gale.
Ultimately, detached properties continue to win the popularity contest, with more transactions since 2021 - demand gliding along steadily, unlike property booms seen careening through city markets. Even so, semi-detached homes tempt those seeking cosier spaces or charming period features on a compact plot, albeit for a slightly pricier deal per square foot. If you are keen on understanding what those figures actually mean for your own home move, a proper Local’s Guide to Understanding Property Worth in Lydbury North can add an extra layer of insight.
So, what are the key takeaway points?
- Detached homes give you more room for your investment with less pressure on each precious square foot.
- Semi-detached homes command a premium per square foot – likely down to a squeeze in supply and a surprising demand for smaller, lower-maintenance countryside pads.
- If you are after the most generous living space without breaking the bank, detached wins out, but savvy buyers will be watching both markets as closely as a shopkeeper watches his till on market day.
Home Prices in Lydbury North vs Other Local Markets
| City | Avg Price (£) | Transactions |
|---|---|---|
| Church Stretton | £358,500 | 569 |
| Ludlow | £273,600 | 1,646 |
| Newtown | £188,100 | 998 |
| Welshpool | £219,200 | 841 |
| Leominster | £260,300 | 1,522 |
| Shrewsbury | £267,700 | 11,847 |
| Llandrindod Wells | £204,200 | 799 |
| Bridgnorth | £272,300 | 1,952 |
| Telford | £187,900 | 10,468 |
| Bromyard | £259,000 | 608 |
When you start looking at house prices in Lydbury North, you get the definite sense that things move at a very different pace compared to its bustling neighbours. Here, values seem to stabilise rather than shoot up, almost as if the local market is anchored down – sturdy, traditional, and less likely to bounce around like a rubber ball in a small room.
One reason for this is the clear gap between the prime hotspots and the more subdued border towns nearby. Looking at the broader region, three key themes jump out:
- Premium demand draws higher prices: Nearby market towns with strong commuter links, like Church Stretton and Bridgnorth, are distinctly pricier. Their scenic settings and desirable period properties pull in steady interest, especially from city leavers or remote workers eyeing somewhere “properly lovely”.
- Border towns stick to lower, more grounded prices: Move towards Welshpool or Llandrindod Wells and you’ll notice the price tags soften. These areas attract price-conscious buyers after more breathing room, and their smaller transaction counts suggest a slower, quieter market – almost as quiet as the lanes on a drizzly Tuesday evening.
- Transaction volumes range dramatically: It’s hard not to notice just how busy places like Shrewsbury and Telford are. Their annual transaction counts tower over the rest, underlining their popularity – think of them as property markets busier than the Ludlow Food Festival on a sunny weekend.
Lydbury North sits somewhere between all these market dynamics. It offers a touch of the idyllic countryside, but without eye-watering prices. With that said, the more affordable areas often see slower movement – not much changes hands, and when it does, it tends to be snapped up by local buyers rather than out-of-towners.
The upshot? For buyers seeking picture-perfect villages, safe schools, and honest-to-goodness scenery – but not wanting to compete in frantic, oversubscribed markets – Lydbury North quietly punches above its weight.
So, what are the key takeaway points?
- Shrewsbury and Telford are activity powerhouses, driving much of the regional housing market with thousands of yearly transactions.
- Church Stretton and Bridgnorth prices stand out as the highest, reflecting demand for homes in picturesque, convenient spots.
- Lydbury North sits under the radar: affordable, steady, and ideal for those who want to avoid the breakneck pace of trendier towns.
As the locals say, ‘In Lydbury North, you buy more than a home - you buy a lifestyle.’
Please be mindful, these figures look strictly at average property prices and transaction activity.
Trends could appear less clear without adjusting for size or square foot price. For detailed comparisons, head to our blog.
Built with Precision. Checked for Fairness.
Valuations are crafted, not copied. Ours reflect smart corrections to trusted data, producing a sharper view of every street and area pricing profile.

