Useful Links
Social
House Prices in Chipping Campden, Gloucestershire: The Facts Behind the Numbers
Look into home type performance in Chipping Campden year by year, with reference points from cities of similar scale and supply.
You’ll also learn which locations have sustained demand across key home categories - and where Chipping Campden fits in.
How much is your Chipping Campden home worth?
Get a personalised estimate based on recent local sales and property type.
What Should Properties in Chipping Campden Cost?
Property Type Breakdown
How big is the property?
Choose your comparison:
Chipping Campden House Prices - Summary
An overview of house prices in Chipping Campden since 2022.
House Prices > Chipping Campden
| Year | Average Price | Transactions |
|---|---|---|
| 2025 (proj.) | £540,100 | 118 |
| 2024 | £528,100 | 89 |
| 2023 | £506,200 | 78 |
| 2022 | £525,500 | 97 |
| 2021 | £507,000 | 183 |
| 2020 | £461,800 | 117 |
| 2019 | £452,300 | 122 |
| 2018 | £464,400 | 137 |
Property prices in Chipping Campden have traced a path of measured upward movement since 2018. There’s no meteoric leap, but a steady, calculated climb that should absolutely pique the interest of any ROI-focused investor.
- The typical home now commands a significantly higher price than it did six years ago, displaying what can only be described as a steady drumbeat of growth.
- That gentle uptick hasn’t run unchecked - 2022 saw a sharper rise, while the years following kept a consistent, moderate momentum. This pattern is enticing for those who prefer predictability to speculative rollercoasters.
Transaction numbers have wobbled more than values, highlighting periods of robust activity in 2021, followed by quieter spells. Even so, projections hint at a welcome resurgence in future transactions - a potential sign that confidence is quietly rebuilding beneath the surface. For investors thinking long-term, that means liquidity is not drying up; there’s always someone waiting in the wings for the right opportunity.
Chipping Campden’s property market is delivering moderate, consistent capital appreciation. Buying here is less of a wild gamble and more like setting roots in rich Cotswold soil - growth may be steady, but it’s robust, and the prospects for wealth-building remain as picturesque as a summer’s sunset on the High Street.
Whatever your budget, it’s worth seeing what’s available in our homes for sale in Chipping Campden listings.
How Property Type Affects House Prices in Chipping Campden

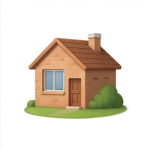
Detached
Avg. Property Price: £682,200
Avg. Size of Property
1,539 sq/ft
Avg. Cost Per Sq/ft
£472 sq/ft
Total transactions
112 (since 2021)

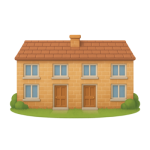
Semi-detached
Avg. Property Price: £490,700
Avg. Size of Property
1,235 sq/ft
Avg. Cost Per Sq/ft
£439 sq/ft
Total transactions
36 (since 2021)

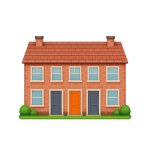
Terraces
Avg. Property Price: £414,000
Avg. Size of Property
927 sq/ft
Avg. Cost Per Sq/ft
£450 sq/ft
Total transactions
56 (since 2021)

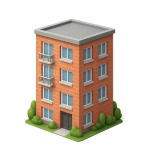
Apartments
Avg. Property Price: £301,300
Avg. Size of Property
952 sq/ft
Avg. Cost Per Sq/ft
£320 sq/ft
Total transactions
8 (since 2021)
Chipping Campden is seeing a property market far from sleepy, with dynamic prices shaped by property type, tech choices, and buyer ambitions. Detached homes top the pricing charts, reflecting their desirability for families seeking more innovation-ready space and privacy. It’s little surprise they’re attracting the highest number of recent transactions by type. Modern buyers want more than bricks and mortar: they want homes ripe for smart upgrades and green retrofits, something detached options offer with their generous average size and flexible layouts.
Semi-detached homes still pack a punch for growing families as well as first-timers who need that small slice of private garden life. With their blend of lower price point and livable internal space, they’re holding a steady appeal. Semi-detached options strike a clever balance, sitting closer to detached in floor area but without the eye-watering price tag.
Flats in Chipping Campden tend to be limited in both stock and size. Yet their lower average price draws solo professionals, downsizers, or investors who value location over sheer footprint. With only a handful of sales since 2021, flats are the rare breed on the Cotswold property safari. Their popularity seems to lag behind, perhaps because so much of Chipping Campden’s housing stock is historic, meaning there are simply fewer purpose-built or conversion apartments available.
Terraced properties bring a uniquely local flavour, reminiscent of the honey-stone rows that line High Street. Prices land them squarely between flats and semi-detached homes, a sweet spot for buyers wanting period charm and walk-everywhere convenience. And while they move less frequently than detached homes, transactions still clock up steadily - a subtle sign that this type offers resilience and strong buyer interest, especially for tech-driven home improvements in smaller spaces.
There’s another point worth chewing on: the cost per square foot varies wildly, with the premium for detached and terraced homes reflecting not only size but a powerful blend of prestige, plot, and potential. For buyers, it’s not just a question of “how much” but “how liveable, how sustainable, and how adaptable to the latest smart tech trends.”
So what’s the core message? Properties in Chipping Campden tell a tale as layered as St. James’ church bells on a market Saturday. If you’re thinking about selling or putting a value on your home, look beyond the averages. Read our smart-pricing guide for Chipping Campden homes here – it’s as crucial as timing your cuppa in a busy tearoom.
What’s the Price Gap Between Chipping Campden and Neighbouring Areas?
| City | Avg Price (£) | Transactions |
|---|---|---|
| Broadway | £433,000 | 605 |
| Moreton-In-Marsh | £384,400 | 997 |
| Shipston-On-Stour | £381,600 | 1,240 |
| Evesham | £283,800 | 4,153 |
| Stratford-Upon-Avon | £374,400 | 5,044 |
| Alcester | £328,900 | 1,069 |
| Pershore | £329,500 | 1,803 |
| Chipping Norton | £408,300 | 1,800 |
| Studley | £291,300 | 709 |
| Warwick | £357,800 | 5,870 |
House prices in and around Chipping Campden show real variety, with numbers tilting from comfortably premium, all the way down to more moderate territory. Even so, it's not just about what the averages say - it's about why those numbers look the way they do, and what strategic buyers are actually getting for their money.
- Prime locations come at a premium. Spots like Broadway and Chipping Norton have average prices that sit in the upper £400,000s, attracting more affluent buyers. That’s classic Cotswolds, and the draw of honey-stone charm isn’t letting up.
- A few bold outliers, like Evesham and Studley, register notably lower average prices, down in the high £200,000s. These towns aren’t just cheaper. They’re also far busier transaction-wise, with Evesham clocking up nearly 4,153 transactions, which signals robust demand and a lot of market activity on the ground.
- If volume’s your guide, Warwick and Stratford-upon-Avon are near the top, both counting over 5,000 sales each. These places are hardly sleepy. The buyer profile here runs from family movers to value-driven investors seeking stable, steady growth.
- Moreton-in-Marsh and Shipston-on-Stour offer that classic ‘gateway-to-the-country’ feel, while still keeping prices in the mid-range, striking a balance for both lifestyle-centric buyers and long-term landlords watching for dependable appreciation.
A striking pattern emerges: areas with higher average prices often see fewer transactions, speaking of exclusivity and a slightly slower-moving market. By contrast, the towns with lower entry prices but more action show that turnover and affordability can go hand in hand. It’s a classic Cotswolds contradiction – the market here is both aspirational and unusually accessible when you know where to look.
What it all means
Chipping Campden and its neighbours present a real spectrum for buyers. Where you land depends on your appetite for pace, prestige, and of course, price. Are you after a peaceful retreat or an active, up-and-coming spot with room for growth? The answer here might take you further than you think.
Please be aware, the following figures show average sales data without adjusting for house size.
They do not adjust for differences in property size or cost per square foot. For a closer view, head over to our blog. Thank you.
Data You Can Believe In
Every valuation is grounded in trustworthy records and sharpened with our bespoke process. By accounting for square footage, build type and energy efficiency, we remove guesswork and deliver stronger pricing clarity. See how we keep it so accurate

