Useful Links
Social
House Prices in Burntwood, Staffordshire: What You Should Know
Observe how Burntwood’s home prices have performed over time using a clear set of sales and pricing indicators.
You'll also be able to pinpoint the areas where demand and prices are picking up.
How much is your Burntwood home worth?
Get a personalised estimate based on recent local sales and property type.
What Should Properties in Burntwood Cost?
Property Type Breakdown
How big is the property?
Choose your comparison:
Burntwood House Prices - Summary
An overview of house prices in Burntwood since 2022.
House Prices > Burntwood
| Year | Average Price | Transactions |
|---|---|---|
| 2025 (proj.) | £271,100 | 471 |
| 2024 | £259,700 | 327 |
| 2023 | £261,300 | 360 |
| 2022 | £261,700 | 501 |
| 2021 | £250,700 | 648 |
| 2020 | £237,800 | 432 |
| 2019 | £209,800 | 444 |
| 2018 | £201,700 | 585 |
The story of Burntwood’s house prices holds a certain bittersweet quality, a touch of longing for quieter, simpler years when homeownership might have felt less unreachable. Prices here have ballooned like kids chasing soap bubbles on a Staffordshire summer afternoon. The jump from late 2010s numbers to today is unmistakable. Back in 2018, you could find an average home without needing to raid the inheritance or win the lottery.
- This surge in average prices after 2019 has been remarkable, but the ride has been anything but smooth – more like trundling down a winding A-road with unexpected potholes.
- Transaction volumes, on the other hand, feel like they've taken a bruising from the weather. Numbers have dipped and yo-yoed, almost as if certainty itself has packed up and left town.
Then again, the stagnation in average prices from 2022 to 2024 whispers of a market caught between ambition and anxiety. People still want roots, but belts are being cinched ever tighter. Numbers of property transactions have grown lean, like cupboards during a cost-of-living winter – no wonder given mortgage headaches and the harsh scent of inflation in the air.
- Inflationary pressures are casting a long shadow on affordability.
- Stubbornly high prices are making first-time buyers think twice – or abandon the quest altogether.
- Unpredictable demand means even estate agents haven’t dared to tempt fate with optimistic predictions.
So what’s the summary? Burntwood’s housing market has become more of a battleground, shaped by volatility and pinched expectations – a far cry from those carefree, steady years at the decade’s start.
On the lookout for value? It’s worth scanning our updated homes for sale in Burntwood.
Property Type Pricing in Burntwood: A Full Breakdown

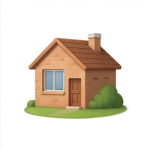
Detached
Avg. Property Price: £338,500
Avg. Size of Property
1,131 sq/ft
Avg. Cost Per Sq/ft
£306 sq/ft
Total transactions
425 (since 2021)

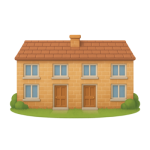
Semi-detached
Avg. Property Price: £230,500
Avg. Size of Property
901 sq/ft
Avg. Cost Per Sq/ft
£263 sq/ft
Total transactions
571 (since 2021)

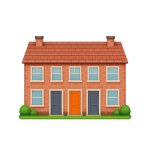
Terraces
Avg. Property Price: £199,100
Avg. Size of Property
822 sq/ft
Avg. Cost Per Sq/ft
£246 sq/ft
Total transactions
375 (since 2021)

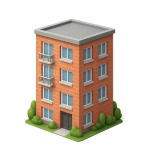
Apartments
Avg. Property Price: £133,400
Avg. Size of Property
610 sq/ft
Avg. Cost Per Sq/ft
£225 sq/ft
Total transactions
43 (since 2021)
Burntwood’s property market delivers a fascinating blend of suburban calm and competitive pricing, especially when you zoom in on the different types of homes consistently attracting buyers since 2021. For those wanting both breathing space and strong resale prospects, detached homes shine with their substantial plots and robust demand, painting a picture perfect for growing families who want that “calm harbour away from the storm”.
Semi-detached properties strike a sweet spot. As the backbone of Burntwood’s sales activity, they combine reasonable price tags with plenty of living space, explaining why they are snapped up by so many. If you are searching for a generous home that balances cost with long-term flexibility, it is tough to look past these ever-popular options. At M0VE, we have seen family-sized semis in Burntwood sell briskly, often attracting a broad spectrum of buyers from first-timers to seasoned upsizers.
Terraced house transactions also paint an intriguing story: while they are more modest in size, their affordability makes them highly accessible. If you are hoping to get a foothold in the local market without overstretching, terraced properties are a clever choice. Still, their cosy layout is often better suited to singles, couples, or savvy investors looking for reliable rental stock. The market for these homes moves at a steady clip, especially in quieter side streets where the buzz rarely fades.
Flats, meanwhile, remain the rare magic beans of Burntwood: far fewer transactions and typically smaller in footprint, but they bring welcome affordability to the table. For buyers who crave ease and want the freedom of a minimal-maintenance lock-up-and-leave, flats here tick important boxes. Still, slower sales show that most people here prefer the extra elbow room and gardens found in houses.
One thing is clear: there is a discernible cost per square foot premium on smaller property types. You are paying for the flexibility of entry rather than expansive space, which makes sense in Burntwood’s pragmatic property cycle.
Curious about what your Burntwood home could command on the open market?
What we can see in Burntwood’s property prices:
- Detached homes deliver aspirational space for higher budgets, but smaller properties offer quicker market entry at a cost premium per square foot.
- For those seeking flexible family living, semi-detached houses dominate activity and offer balanced value that is hard to beat.
- Terraced homes drive affordable ownership in long-established pockets, while flats cater to those who prioritise simplicity and convenience above all.
Burntwood vs Nearby Areas: House Price Comparison
| City | Avg Price (£) | Transactions |
|---|---|---|
| Cannock | £204,100 | 6,692 |
| Lichfield | £319,300 | 5,384 |
| Rugeley | £232,900 | 3,168 |
| Walsall | £199,700 | 14,170 |
| Willenhall | £169,500 | 3,682 |
| Sutton Coldfield | £356,100 | 10,613 |
| Wednesbury | £160,500 | 3,077 |
| West Bromwich | £180,200 | 3,716 |
| Bilston | £160,000 | 3,271 |
| Wolverhampton | £207,500 | 18,880 |
The story on Burntwood’s house prices is more than just numbers - it’s a swirling blend of busy transactions, sharp contrasts, and shifting demand, all against the backdrop of Staffordshire’s evolving tech energy. For buyers and sellers alike, a bit of smart number-crunching goes a long way right now.
Glance north to Cannock and Wolverhampton and you’ll find price tags that are decently approachable, supporting plenty of movement - properties there change hands with a regularity that’s hard to ignore. On the flip side, spots like Lichfield and Sutton Coldfield have become magnets for aspirational buyers, commanding hefty price points and attracting those who want a slice of the high-end market. Transaction levels in these postcode hotspots remain robust, suggesting buyers aren’t scared off by the premium price tags.
- Tech-fuelled innovation is driving buyer behaviour in Burntwood just as much as in its neighbours.
- Affordability remains a key draw in Cannock, Willenhall and Bilston, keeping demand simmering for first-time buyers chasing a foothold on the ladder.
- Lichfield and Sutton Coldfield are in a luxury bracket of their own, with prices stretching higher and buyer profiles skewing more professional and family-oriented.
- Walsall stands out for its rapid-fire transactions - moving property here is as fast-paced as a Saturday queue at the chippy.
- Burntwood itself occupies a dynamic middle ground. Affordable enough to remain competitive, yet desirable enough to attract forward-thinking buyers drawn by energy-efficient homes, green builds, and a quietly growing buzz.
If you’re looking for a spot that balances steady value, lively market activity, and an open door for tech-led home improvements, Burntwood deserves a closer look.
So, what are the key takeaway points?
- Lichfield and Sutton Coldfield lead for premium pricing and aspirational living.
- Cannock and Wolverhampton suit practical buyers who value both movement and affordability.
- Burntwood is smartly positioned for buyers who want innovation without the ultra-high price tag.
Looking ahead, expect Burntwood to keep buzzing - especially as the tech-savvy crowd pushes for smarter, greener housing.
Quick reminder: these figures reflect only simple averages across Burntwood and neighbouring areas.
No adjustments have been made for home sizes or per square foot value. For deeper insights, head over to our blog. Thanks for reading.
Authenticity at Every Step
We take credible records, then smooth and recalibrate them - removing distortion and giving each street its own honest price profile. Check out what goes into every estimate

