
House Prices > York
| Year | Average Price | Transactions |
|---|---|---|
| 2025 (proj.) | £346,800 | 5,319 |
| 2024 | £336,100 | 3,716 |
| 2023 | £338,900 | 4,605 |
| 2022 | £333,300 | 5,523 |
| 2021 | £321,700 | 7,097 |
| 2020 | £298,500 | 4,948 |
| 2019 | £281,000 | 5,599 |
| 2018 | £279,000 | 5,743 |
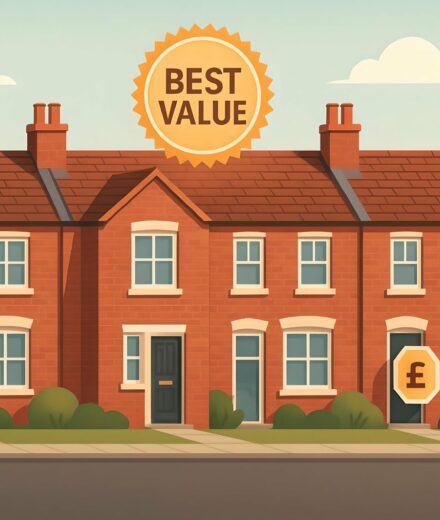
York’s property market over the past seven years has, quite frankly, seen some astounding twists and turns—the sort that would make even a seasoned estate agent pause and say, “That’s impressive.” If you have been house hunting or thinking about selling, you might have felt the sense that finding a truly affordable home is now like searching for a decent car parking space on Shambles Market day—almost mythical.
Looking at the trends, a few things stand out:
If we take a step back, the data shares several possible reasons for these changes. As prices soar, some buyers are inevitably priced out, which reduces transactions. Economic uncertainty, shifting interest rates, and altered buyer priorities post-pandemic all add new layers. For those wanting to understand the finer points, What Impacts House Prices in York? A Simple Valuation Guide offers even more context.
With that said, the story here is one of growth salted with caution. Properties are not just a home—they are an increasingly rare prize. Buyers need to be quick and informed if they want a foothold in this beautifully historic city.
With average house prices projected to breach £340,000, the York property market proves tougher to enter than ever—finding a budget-friendly home here really is like finding a four-leaf clover on the Knavesmire.
Curious about the local market? Have a scroll through the available houses for sale in York.

Avg. Property Price: £467,600
Avg. Size of Property
1,479 sq/ft
Avg. Cost Per Sq/ft
£332 sq/ft
Total transactions
2,327 (since 2021)
Avg. Property Price: £311,500
Avg. Size of Property
967 sq/ft
Avg. Cost Per Sq/ft
£332 sq/ft
Total transactions
3,093 (since 2021)
Avg. Property Price: £286,000
Avg. Size of Property
899 sq/ft
Avg. Cost Per Sq/ft
£323 sq/ft
Total transactions
4,193 (since 2021)
Avg. Property Price: £224,200
Avg. Size of Property
685 sq/ft
Avg. Cost Per Sq/ft
£335 sq/ft
Total transactions
471 (since 2021)
York's property scene presents a multi-layered mosaic, where demand, size, and per-square-foot pricing interact vigorously for every major property type. Detached homes set a conspicuous benchmark, regularly traded at a noticeable premium on city outskirts and leafy, established neighbourhoods. Though they account for a lesser share of transactions, their high average sale price and sizeable living areas speak volumes about buyer preferences—especially for those who seek seclusion, expansive gardens, or dream of home offices with bucolic views. It is the old adage—space comes at a premium, but commands loyalty among upgraders.
Semi-detached sales surge ahead in transaction volume, outpacing even the mighty terraced stock. Clearly, these properties have become the unsung stalwarts of York—solid, broadly attainable, and climbing with quiet consistency. Their near-identical cost per square foot to detached homes hints that the market assigns them immense practical value. We often observe busy family buyers eyeing these homes for their blend of garden space, parking, and manageable layouts. The data suggests semi-detached dwellings in York are veritable warhorses—steady, rarely dramatic, but always in style.
Terraced home transactions underscore their Herculean popularity, especially in York’s grid of Victorian and Edwardian districts. Here, proximity to the Shambles or Bishopthorpe Road shops is prized as much as square footage. The lower average price and cost per square foot indicate a sweet spot for both young professionals and seasoned investors seeking efficient capital deployment. Buyers in York know terraced streets are where heritage and financial prudence intersect.
Flats, comparatively, are few and far between—yet they command the highest cost per square foot in the city. This metric shines a stark light on how central location, convenience, and lower maintenance sometimes edge out sheer space. With a relatively modest footprint, you—if you are after city-centre buzz or want a lock-up-and-leave pad—will find this sector appealing, though your investment per square foot is premium. Still, York’s flats have seen steady activity numbers, often concentrated north of Micklegate or in imaginatively repurposed mills.
If you are curious about the mechanics behind these pricing disparities, we unpack these drivers in our deep-dive on York property affordability rankings.
| District | Avg Price (£) | Transactions |
|---|---|---|
| YO1 | £317,400 | 1,272 |
| YO2 | £842,500 | 4 |
| YO3 | £195,000 | 1 |
| YO4 | £171,500 | 2 |
| YO6 | £177,000 | 1 |
| YO10 | £280,500 | 2,513 |
| YO17 | £133,500 | 1 |
| YO19 | £354,900 | 1,637 |
| YO23 | £361,600 | 2,604 |
| YO24 | £291,700 | 3,629 |
| YO26 | £323,100 | 3,883 |
| YO30 | £293,200 | 3,363 |
| YO31 | £288,400 | 3,526 |
| YO32 | £321,700 | 2,940 |
| YO41 | £312,700 | 1,503 |
| YO42 | £287,700 | 3,219 |
| YO43 | £241,600 | 1,971 |
| YO51 | £335,000 | 1,440 |
| YO60 | £404,700 | 459 |
| YO61 | £361,200 | 2,048 |
| YO62 | £334,100 | 1,553 |
York’s property market, postcode by postcode, is a living patchwork that reflects its quirky history and energetic growth. Walking through the city, you feel each district’s personality — some streets are hotter property than a last-minute Glastonbury ticket, while others remain calm and quietly tempting for savvy buyers.
Let’s be honest, you’re not short on choice in York — but what you pay, and how fast you need to move, might surprise you.
Plump for a city centre setting, and you’ll encounter average prices that turn heads, but the action is thickest in the city’s leafy outskirts. Districts like YO23, YO24, YO26, and YO31 are positively bustling with thousands of annual transactions. These are the darling zones for families and those craving a bit more living space, without taking a punt on the distant countryside. Here, homes go for healthy six-figure sums, often circling or nudging above £290,000 — not pocket change, but not sky-high either.
Want something posher? YO2 is York’s glitzy outlier, where the average sale price pushes north of £800,000, albeit with only a handful of transactions to show for it. It’s the classic dilemma: prestige and rarity go hand in hand. These properties are more coronation tiara than everyday flat cap.
By contrast, pockets on the city’s edge like YO17, YO6 or YO4 often deliver the cheapest keys, sometimes revealing average prices trailing below £180,000. If you’re watching the pennies, these districts deserve a closer nosey, especially given they’re not short on charm either. Thinking of stretching your deposit further? Discover the value areas of York for first-timers and investors.
What really stands out is just how much neighbourhood matters. Certain postcodes see barely a handful of sales all year, while others feel busier than Bettys on a Saturday. It pays to think council schools, station links and even the hidden treasures on your doorstep.
The takeaway is simple: York’s districts can be wildly different in cost and activity. Whether your style is luxury or low-key, there’s a sweet spot if you know where to look. For more on why the postcode makes all the difference, see our guide to what’s driving the price gap in York.
Please also check out the following areas in York for further insights:
| City | Avg Price (£) | Transactions |
|---|---|---|
| Tadcaster | £292,500 | 1,092 |
| Selby | £217,700 | 4,613 |
| Wetherby | £367,100 | 2,637 |
| Malton | £261,400 | 1,714 |
| Knaresborough | £351,500 | 2,101 |
| Goole | £188,300 | 4,134 |
| Harrogate | £343,000 | 10,615 |
| Knottingley | £150,200 | 1,610 |
| Thirsk | £268,300 | 1,749 |
| Castleford | £166,900 | 6,001 |
Think York is pricier than its neighbours? Not always. The property race around York is far from dull – with buyers darting from town to town like seagulls after chips on Scarborough seafront. It is a landscape filled with rich contrasts and unexpected trends.
Don’t fall for the myth that “everywhere near York is sky-high.” There are still distinctly affordable pockets, each with its own advantages. Harrogate might have glitz, but places like Selby and Goole move almost as brisk as the York market itself, despite sitting at completely different price points.
Think York’s market is out of reach? Selby and Goole prove otherwise. Around here, affordability and aspiration can share the same postcode.
Please note, these comparisons focus just on average price points and transaction activity.
Trends could appear less clear without adjusting for size or square foot price. For detailed comparisons, head to our blog.
Housing data is our starting point, but not the destination. We adjust each figure with intelligence and precision to reveal something more practical.
Our site uses cookies. By using this site, you agree to the Privacy Policy and Terms of Use.