
Sunderland’s market isn’t volatile, but it is alive. From modest value rises to small shifts in transaction volume, the rhythm is steady and worth a look.
This page delivers a full breakdown of Sunderland’s recent housing performance, complete with price tracking by district, comparisons across property types, and a clear indication of where movement has been strongest or most consistent.
House Prices > Sunderland
| Year | Average Price | Transactions |
|---|---|---|
| 2025 (proj.) | £163,300 | 2,737 |
| 2024 | £159,500 | 2,177 |
| 2023 | £162,800 | 2,602 |
| 2022 | £168,800 | 3,309 |
| 2021 | £165,300 | 3,495 |
| 2020 | £144,500 | 2,476 |
| 2019 | £146,000 | 2,643 |
| 2018 | £139,800 | 2,455 |
If we pause for a moment and gaze at Sunderland’s year-by-year house values, we see more than just numbers. It’s a story of resilience, adaptation, and the city’s unvarnished character. Prices in Sunderland have ebbed and flowed, refusing to follow a single, monotonous curve. Like the changing tides at Roker Beach, there’s motion here - sometimes restless, sometimes calm, but never static.
For every potential buyer, there’s a question—are we heading for another upward sprint, or are these stop-start years here to linger? If you are pondering your next step, try our guide to where property is still affordable in Sunderland today and remember, a careful move now could reward you handsomely later.
So, what can we settle on? Sunderland’s property cycle is a living, breathing thing, shaped by local hopes and national moods. Observing these changes prepares us, whether we’re buying a first home, scouting for a savvy investment, or just watching the city’s pulse from our own front window.
Exploring your options? Don’t miss the opportunity to view properties for sale in Sunderland.

Avg. Property Price: £319,400
Avg. Size of Property
1,386 sq/ft
Avg. Cost Per Sq/ft
£234 sq/ft
Total transactions
1,061 (since 2021)

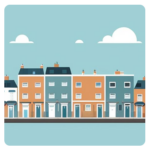
Avg. Property Price: £162,200
Avg. Size of Property
943 sq/ft
Avg. Cost Per Sq/ft
£173 sq/ft
Total transactions
3,458 (since 2021)
Avg. Property Price: £117,800
Avg. Size of Property
941 sq/ft
Avg. Cost Per Sq/ft
£129 sq/ft
Total transactions
4,176 (since 2021)
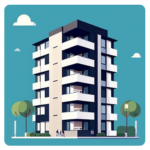
Avg. Property Price: £94,700
Avg. Size of Property
628 sq/ft
Avg. Cost Per Sq/ft
£167 sq/ft
Total transactions
263 (since 2021)
Sunderland's property market has quietly carved out its own distinct rhythm, shaped by the pragmatic preferences of local buyers and an eye for cost-effective living. Terraced and semi-detached homes make up the bedrock of activity, covering thousands of transactions since 2021. Fierce demand for these reliable property types signals a broad appetite for accessible, spacious housing on a sensible budget.
Detached houses in Sunderland are the crown jewels in the city’s residential patchwork, glimmering with their generous footprints and standout privacy. Commanding the highest average price, these homes sprawl over spacious plots and fetch a robust cost per square foot which far outpaces other types. Even so, with more than a thousand sales since 2021, buyers have not been shy in competing for that extra luxury. Detached homes are especially attractive to families planning for the long haul, or anyone with grand plans and the resources to match.
On the opposite end of the spectrum, flats in Sunderland paint a nimble, affordable picture. Their average price sits comfortably below the city average, keeping ownership within arm’s reach for first-time buyers, downsizers, and students. Even though flats traditionally see fewer transactions than houses, the market for them is steady, practical, and often buoyed by fast-paced urban living. Think bustling city-centre convenience rather than sprawling lawns.
Semi-detached and terraced homes, meanwhile, continue to be the city’s reliable workhorses. Terraced properties post the highest transaction volume, proving that Sunderland’s appetite for value-driven family homes is keener than ever. Meanwhile, semi-detached homes, with their slightly larger sizes and balanced prices, appeal to those looking to climb the property ladder without venturing into luxury territory. Both types deliver a cost-per-square-foot sweet spot that balances affordability and liveability – a rare harmony in today’s unpredictable property market.
When you stack up the numbers side by side, a few things are crystal clear:
Sunderland’s market right now is anchored in pragmatism. It rewards value-seekers, family buyers, and prestige hunters alike. Want to know how these trends shape what your house could be worth? Thinking of Selling in Sunderland? Here’s How to Value Your Home.
| District | Avg Price (£) | Transactions |
|---|---|---|
| SR1 | £114,500 | 678 |
| SR2 | £154,900 | 3,995 |
| SR3 | £177,000 | 3,925 |
| SR4 | £119,300 | 4,474 |
| SR5 | £112,400 | 2,556 |
| SR6 | £218,800 | 3,693 |
Sunderland’s property prices reflect a fascinating patchwork of both tradition and transformation, with each district telling its own story. From the buzz near the riverbanks to the quieter corners up north, it’s clear that price, popularity, and buyer preferences vary quite noticeably across the city.
SR6 sits at the top of the price spectrum, where those after a slice of seaside life or leafy seclusion can expect to pay a fair premium. The draw of coastal walks, village cafes and larger family homes makes this part of the city especially appealing for established households or anyone with their eyes on something a touch grander.
SR3 and SR2 follow close behind, with prices that reflect their broad, family-friendly appeal and abundance of modern, roomy properties. These areas often attract buyers looking for a strong sense of community and a good blend of schools, local amenities, and green spaces. It’s an inviting option for upsizers or those wanting a bit more breathing space without venturing too far out.
Notably, transaction numbers are healthiest in SR4, SR2, and SR3, pointing to a dynamic mix of buyers and sellers moving through these parts of the city. For many locals, it’s the “neither too expensive, nor too far from town” charm that tips the balance.
Sunderland’s market moves with both tradition and surprise, so whether you’re buying or selling, understanding this district-level detail is vital. For homeowners curious about the true worth of their property, here’s how to value your Sunderland home.
Please also check out the following areas in Sunderland for further insights:
| City | Avg Price (£) | Transactions |
|---|---|---|
| East Boldon | £236,700 | 550 |
| Washington | £157,100 | 4,018 |
| Houghton Le Spring | £159,500 | 4,392 |
| Seaham | £133,800 | 2,405 |
| South Shields | £140,200 | 6,597 |
| Jarrow | £134,400 | 1,735 |
| Hebburn | £161,100 | 2,549 |
| Chester Le Street | £166,400 | 4,261 |
| Gateshead | £145,100 | 10,342 |
| North Shields | £205,500 | 6,356 |
Sunderland’s house prices are in the middle of the pack when compared to its nearest neighbours, with the area quietly holding its ground between bargain towns and pricier villages. There’s a marked gap between Sunderland and more sought-after locations like East Boldon or North Shields, where the average home is noticeably steeper. Think of Sunderland’s market as a steady climber - moving upward with the quiet confidence of a Wearside rambler conquering Penshaw Hill.
What immediately stands out is just how widely values swing. Neighbouring Washington and Houghton Le Spring hover close together, offering average prices that are distinctly modest. When compared with the likes of Seaham, Jarrow or even South Shields, you notice how compact, cost-conscious options are plentiful. First-time buyers or investors looking for entry-level opportunities will find fertile ground here.
If you’re thinking about a move, Sunderland is still a truly solid bet for those who value predictability and diverse housing in the heart of the North East.
Just a reminder, these figures compare simple averages for price and number of sales.
Property size and cost per square foot are not factored in, meaning some shifts may be missed. To explore further, visit our blog.
By refining robust datasets with fresh, location-sensitive techniques, we carve out crystal-sharp property estimates. Raw data from EPCs and sale registries is massaged gently through our valuation process - exposing subtleties, cleaning distortions. Explore how the data takes shape
Our site uses cookies. By using this site, you agree to the Privacy Policy and Terms of Use.