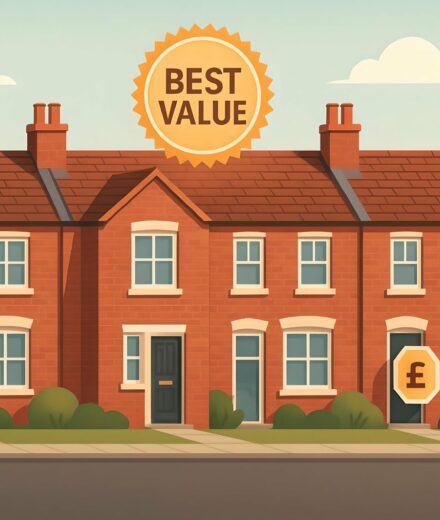

You might not notice the change week to week, but zoom out and Reading’s prices are gently rearranging themselves.
You’ll find a focused summary of the Reading market here – from week-by-week activity to long-term performance trends – laid out in a way that saves time while offering meaningful takeaways.
House Prices > Reading
| Year | Average Price | Transactions |
|---|---|---|
| 2025 (proj.) | £432,500 | 5,312 |
| 2024 | £425,200 | 3,851 |
| 2023 | £422,100 | 4,599 |
| 2022 | £417,900 | 5,979 |
| 2021 | £407,000 | 7,088 |
| 2020 | £395,000 | 4,543 |
| 2019 | £385,900 | 5,434 |
| 2018 | £384,100 | 5,690 |
The Reading housing market moves in mysterious ways – a bit like the weather around here. If you’ve watched property prices tick upwards each year, you’re not alone. From leafy suburbs to lively student quarters, this town has quietly shed its skin, growing more appealing (and, let’s be honest, more costly) every year since 2018.
What’s putting the rocket under these values? At M0VE, we’ve noticed:
Thinking of moving up, moving in, or cashing out? If so, Reading is a town where timing matters – but patience may be rewarded if you stay alert. Buyers and sellers alike are tuning into the smallest shifts. Rival offers land fast in hotspots while some homes linger, unseen, for weeks. For a more granular look at where your property sits in the price race, take a peek at our Reading House Prices: What’s Your Property Worth in 2025? guide.
The takeaway is simple: Reading is moving, sometimes erratically, but always in pursuit of something brighter. Your next home might just be part of the story.
Before jumping in, it’s wise to see what our Reading property market looks like today.

Avg. Property Price: £616,700
Avg. Size of Property
1,421 sq/ft
Avg. Cost Per Sq/ft
£457 sq/ft
Total transactions
1,285 (since 2021)

Avg. Property Price: £445,100
Avg. Size of Property
1,070 sq/ft
Avg. Cost Per Sq/ft
£429 sq/ft
Total transactions
1,704 (since 2021)

Avg. Property Price: £310,200
Avg. Size of Property
817 sq/ft
Avg. Cost Per Sq/ft
£389 sq/ft
Total transactions
4,059 (since 2021)

Avg. Property Price: £280,200
Avg. Size of Property
676 sq/ft
Avg. Cost Per Sq/ft
£421 sq/ft
Total transactions
1,320 (since 2021)
Reading’s property market is a swirling mix of aspiration and value, with each property type painting a distinct picture of local appetite and affordability. The disparity in both price points and transaction counts feels almost as lively as Broad Street on a Saturday morning, revealing just how diverse Reading’s buyers and sellers really are.
Detached homes, with their wonderfully commanding price tags and roomy interiors, target buyers after premium living and a touch of seclusion. With a consistently high cost per square foot, detached properties signal the enduring appeal of peaceful suburban streets, where families often settle for “the long haul.” These homes offer that calm harbour away from the storm feel for those with larger budgets or multigenerational needs.
In the brisk mid-range, semi-detached homes continue to bridge the gap between value and space. They draw in energetic young families, couples, and up-sizers who want a tad more garden without splashing out at the very top of Reading’s property ladder. Activity levels remain robust, and their blend of affordability, flexibility and solid resale potential rarely goes unnoticed. Streets lined with these properties feel friendly and approachable—a “sweet spot” segment that has held up even as national prices have zigzagged.
Terraced homes, meanwhile, fill a crucial niche. They remain the quintessential choice for buyers who want city-centre accessibility, character, and affordability. Transaction figures here are resoundingly high, which highlights the sustained demand for compact, cleverly designed terraces. In Reading’s more central postcodes, their popularity makes sense. Investors know all too well that these homes often combine quicker rental yields with reliable long-term returns. For more on which areas currently punch above their weight, see the top value-for-money Reading districts.
Flats paint a different story altogether. Frequently sought after by first-time buyers, renters, or the ultra-mobile, their price points remain relatively high per square foot. This is a genuine reflection of Reading’s urban drive, job market confidence, and proximity to transport. With flats buzzing like The Oracle on a Friday night, the numbers suggest that condos and new-build blocks remain a steadfast fixture in the market, even as leaseholds and high service charges come under closer scrutiny.
| District | Avg Price (£) | Transactions |
|---|---|---|
| RG1 | £313,500 | 5,566 |
| RG2 | £401,600 | 5,951 |
| RG3 | £243,800 | 1 |
| RG4 | £478,600 | 4,155 |
| RG5 | £411,400 | 2,851 |
| RG6 | £421,600 | 3,287 |
| RG7 | £452,100 | 4,253 |
| RG8 | £518,400 | 1,726 |
| RG10 | £538,500 | 1,804 |
| RG30 | £311,800 | 4,834 |
| RG31 | £387,700 | 3,084 |
Reading’s property market is looking more unpredictable than the British weather, with prices and activity levels in its districts darting all over the map. The city centre, RG1, is the go-to for buyers after a lively postcode and a bit more affordability, but blink and you’ll miss the real action in the leafy surrounds on Reading’s edges. If you feel like prices are climbing faster than a cat up a tree during a thunderstorm, you’re not imagining it – some districts here are outpacing others by a mile.
Let’s start in the heart of the city: RG1. This is where volume shines, with a bustling 5,566 property transactions in recent years. Although its average price is lower than nearly every other Reading area, that’s exactly what keeps the transactions flowing. Flats tend to dominate, meaning more opportunities for first-time buyers or anyone wanting city-centre convenience without gifting their wallet to the estate agent.
Then we hit the stately outer postcodes. RG8, RG10, and RG4 are the places catching those eye-watering figures, thanks to top-rated schools, riverside living, and a distinctly ‘grand’ feel. Think chocolate box villages and commuter comfort. Here, properties command a proper premium. If you’re looking for the “Aston Martin of Reading addresses”, you’re in the right place.
Where does that leave the mid-range zones like RG2, RG5, and RG6? These are real crowd-pleasers, offering bigger homes, more green space and a lovely balance of access and value – and with transaction numbers that prove people are voting with their feet. Buyers after substance as well as flash are snapping up homes here, balancing council tax, garden size and a friendly community feel.
That’s not to say there aren’t quirks. RG3, for example, has just one lonely transaction recorded. Is it a statistical blip, or the Reading equivalent of a unicorn sighting? Either way – not your average property hunt!
It’s clear that where you look in Reading really does shape what you’ll get for your money. Whether you’re eyeing up an affordable flat with an easy walk to the station or holding out for a riverside spot surrounded by ancient oaks, the district you pick can mean a price tag difference of more than a pub lunch or two.
Curious where your own property ambitions best fit? Check out The Best Value-for-Money Districts in Reading to see which neighbourhoods are attracting the savviest homebuyers.
All in all, Reading’s districts are serving up property choices that are more varied – and sometimes surprisingly affordable – than you might expect, if you know where to look.
Please also check out the following areas in Reading for further insights:
| City | Avg Price (£) | Transactions |
|---|---|---|
| Wokingham | £467,100 | 6,041 |
| Henley-On-Thames | £559,100 | 1,605 |
| Crowthorne | £486,900 | 1,873 |
| Tadley | £378,400 | 1,799 |
| Yateley | £433,100 | 1,415 |
| Bracknell | £365,000 | 8,463 |
| Sandhurst | £409,200 | 1,372 |
| Hook | £472,300 | 2,294 |
| Maidenhead | £481,800 | 6,350 |
| Thatcham | £373,400 | 2,982 |
The dream of securing a family home in Reading, once a fairly simple goal, has gradually become a bittersweet challenge. The property market here has taken on a character all its own, moving faster than the queue at Reading Station on a drizzly Monday morning. But how do local prices compare when you glance over the garden fence into neighbouring towns?
It’s impossible to ignore Reading’s position as a crossroads, not just for commuters, but for the ebb and flow of the property market itself. Some nearby areas now outpace Reading’s house prices by a surprising margin, while others tempt buyers with offers that seem only just within reach.
Even so, Reading finds itself balancing between aspiration and accessibility. Buyers must act decisively – homes often sell quicker than you can say “double espresso at Workhouse Coffee”.
Buying in and around Reading is a complex, shifting puzzle. If you’re casting your net wide, knowing these subtle local differences is as crucial as having your mortgage in principle ready. The bittersweet truth? Choice is plentiful, but opportunities now vanish in a blink.
Please note, these figures highlight average prices and total transactions without adjusting for property sizes.
Property size and cost per square foot are not factored in, meaning some shifts may be missed. To explore further, visit our blog.
We refine public records to better match the market as it really is. Each valuation includes subtle corrections that adjust for size, type and energy grade without overcomplicating the picture.
Our site uses cookies. By using this site, you agree to the Privacy Policy and Terms of Use.