
Compare the last six years of transaction patterns across Norwich by property type and district, supported by regional benchmarks.
You’ll also be able to evaluate whether internal growth reflects wider trends or suggests independent momentum.
House Prices > Norwich
| Year | Average Price | Transactions |
|---|---|---|
| 2025 (proj.) | £311,100 | 7,249 |
| 2024 | £302,700 | 5,258 |
| 2023 | £311,500 | 6,229 |
| 2022 | £317,000 | 7,951 |
| 2021 | £300,500 | 9,357 |
| 2020 | £280,000 | 6,499 |
| 2019 | £266,000 | 7,568 |
| 2018 | £258,000 | 7,879 |
Despite the headline growth in property prices in Norwich, a closer examination reveals some unsettling trends. Since 2018, average property prices have risen, peaking in 2022 at £317,000, before experiencing a slight decline to £302,700 in 2024. This fluctuation can feel like house prices are bouncing around like a rubber ball in a small room, raising questions about the stability and future trajectory of the market.
A curious downturn in the number of transactions coincides with these price shifts. The high point in 2021 when there were 9,357 transactions appears as an anomaly compared to the steady decrease observed in subsequent years, declining to just 5,258 in 2024. This dip prompts further inquiries:
The potential ramifications of this volatility are worth pondering. If prices continue to drop, it could indicate a cooling off period, impacting both future buyers and investors. Alternatively, if prices start to climb again without transactional growth, it could intensify existing affordability issues, especially for first-time buyers.
An internal view into 2023 suggests an upswing in projected prices at £311,100, hinting that the market might stabilize or even recover. Thinking of selling in Norwich? It’s vital to stay informed about such trends to understand their potential effects on property investments.
Norwich's property landscape, like a Norwich market square on a summer’s day, remains unpredictable. For those contemplating a purchase, it's comparable to planting a fruit tree - rewards might come with patience and a keen understanding of market dynamics.
Before making any decisions, it’s smart to explore the live houses for sale in Norwich.
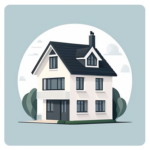
Avg. Property Price: £433,500
Avg. Size of Property
1,409 sq/ft
Avg. Cost Per Sq/ft
£323 sq/ft
Total transactions
4,095 (since 2021)
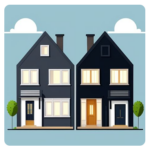
Avg. Property Price: £284,600
Avg. Size of Property
958 sq/ft
Avg. Cost Per Sq/ft
£306 sq/ft
Total transactions
3,613 (since 2021)
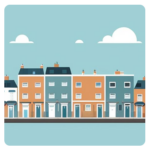
Avg. Property Price: £239,600
Avg. Size of Property
842 sq/ft
Avg. Cost Per Sq/ft
£289 sq/ft
Total transactions
5,170 (since 2021)
Avg. Property Price: £166,800
Avg. Size of Property
638 sq/ft
Avg. Cost Per Sq/ft
£266 sq/ft
Total transactions
1,234 (since 2021)
Norwich's property market offers a fascinating panorama of price and size variations across different housing types, with nuances that are essential for astute investors and homeowners to comprehend. Whether you're considering a cozy flat or a sprawling detached home, understanding these specificities can steer your decision-making process more effectively. In an area buzzing with charm akin to a market day in the city centre, each property style brings with it a unique cost and value proposition.
For those with a penchant for space, detached homes stand a cut above the rest. Boasting an average price of £433,400 and a spacious footprint of 1,410 sq/ft, these homes come at a premium, underscored by a higher £320 per sq/ft. It's apparent that buyers appreciate the expansive living areas combined with a more secluded residential feel, counting approximately 4,083 transactions.
Conversely, flats represent a more accessibly priced option, with an average cost of £166,900 and a reasonable 640 sq/ft of living space. With a £270 per sq/ft cost, flats are particularly appealing to young professionals and first-time buyers looking for lower maintenance living. With around 1,230 transactions recorded, their popularity in the urban setting is undeniable, much like a Saturday evening at a local pub.
Semi-detached properties form the middle ground, offering modest space at 960 sq/ft and a competitive average price of £284,900, with a £310 per sq/ft rate. These options are preferred by families looking for a mix of price and size, showing a healthy transaction volume of around 3,589 sales.
Terraced homes, with their historic charm, maintain significant market activity with over 5,150 sales. They are priced on average at £239,600 for a comfy 840 sq/ft, with a £290 per sq/ft rate. They cater well to buyers valuing proximity to city amenities. With demand still running high, terraced homes offer a compelling mix of value and location.
So what's the core message? Norwich's diverse property types align with a broad spectrum of buyer needs. Whether investment-driven or looking for a forever home, opportunities span the board. For a broader understanding of the Norwich property scene, exploring [investment hotspots](https://m0ve.com/blog/best-areas-to-invest-in-property-norwich/) is pivotal. Striking the right balance between budget, space, and location is crucial in this lively market.
| District | Avg Price (£) | Transactions |
|---|---|---|
| NR1 | £225,400 | 4,351 |
| NR2 | £279,500 | 3,339 |
| NR3 | £209,800 | 4,124 |
| NR4 | £341,700 | 2,764 |
| NR5 | £251,200 | 2,761 |
| NR6 | £263,900 | 3,343 |
| NR7 | £267,800 | 4,636 |
| NR8 | £281,700 | 3,310 |
| NR9 | £323,300 | 2,831 |
| NR10 | £306,600 | 2,653 |
| NR11 | £323,700 | 2,514 |
| NR12 | £306,300 | 3,218 |
| NR13 | £333,600 | 4,385 |
| NR14 | £348,900 | 3,690 |
| NR15 | £326,000 | 1,754 |
| NR16 | £358,900 | 1,521 |
Norwich's property market is a delightful maze of quirky and colorful districts. Each seems to have its own little drama, and oh what a drama it is! With house prices ranging from what you'd spend on a decent used car to numbers that might make your eyes water, it's no wonder navigating this market could feel like you're chasing after a will-o'-the-wisp.
Isn’t it fascinating that in NR1, homes are almost as common as chips on a Friday night? It’s one of the busiest areas with lots of recorded transactions. But for a £225,400 price tag, who’s really surprised? It’s practically giving them away! Meanwhile, if you were thinking of setting down roots in NR4, you might as well start saving up; the average price there is a whopping £341,700. That’s if you can find something amongst the 2,764 consummated sales.
And then there's cozy NR7 where you might be lucky enough to snap up a house for around £267,800. It's quite the hotspot with 4,636 transactions—not bad if you’re feeling the desire to be at the heart of all the excitement. NR7 buyers could be as common as ducks in the Broads.
Getting an offer accepted in the coveted NR13 might feel akin to winning a golden ticket to Willy Wonka’s factory, given the respectable £333,600 average price, which comes with 4,385 homes being snapped up. You're more likely to find yourself committing to multiple fruitless bidding wars before succeeding.
If you're really keen on diving headfirst into the deep end, NR14 would happily take £348,900 off your hands. A beautiful area, but with house prices like that, better start double-checking down the back of the sofa for those lost pennies. Perfect if your pursuit of suburban charm includes a focus on exclusivity as 3,690 transactions might attest.
Well, Norwich residents, it’s a eccentric dance of prices and aspirations. No matter your spending bracket, there’s a corner of Norwich that can promise both challenges and delights.
Please also check out the following areas in Norwich for further insights:
| City | Avg Price (£) | Transactions |
|---|---|---|
| Wymondham | £294,700 | 3,055 |
| North Walsham | £260,800 | 1,957 |
| Bungay | £281,200 | 894 |
| Dereham | £277,600 | 3,692 |
| Attleborough | £292,600 | 2,188 |
| Harleston | £291,800 | 794 |
| Great Yarmouth | £200,700 | 7,061 |
| Beccles | £294,100 | 1,812 |
| Cromer | £301,300 | 1,404 |
| Diss | £322,100 | 2,296 |
In Norwich, the property market has been moving quicker than a barista during the morning rush. With its vibrant urban offerings and historical charm, it feels like every street is brewing something exciting for prospective buyers. But how does it compare to its neighbouring areas? Let’s take a closer look.
Neighbouring towns paint a vivid tapestry of value and variety:
Think of North Walsham and Bungay as the quiet suburbs—ideal for buyers craving peace without being too detached. On the other hand, **Attleborough** and **Beccles** offer moderate pricing with their own flavour of easy-going lifestyle.
With that said, the market in Norwich seems to combine the best of all worlds. While prices haven't hit the same peaks as neighbouring Diss, they remain competitive, promising excellent potential for growth and investment.
So, what are the key takeaway points? Norwich stands as a versatile destination with thriving appeal and sensible pricing, ready for anyone looking to stake their claim in this wonderful city. And while surrounding areas have their unique draws, Norwich provides a dynamic blend of urban life and historical culture, perfect for adventurous souls. With a mix of affordability and potential, are you ready to explore Norwich?
Please be aware, the following figures show average sales data without adjusting for house size.
They do not adjust for differences in property size or cost per square foot. For a closer view, head over to our blog. Thank you.
Each valuation is fed by detailed corrections that balance the data for your local context. Nothing overblown, just quietly reliable. See our valuation process in action
Our site uses cookies. By using this site, you agree to the Privacy Policy and Terms of Use.