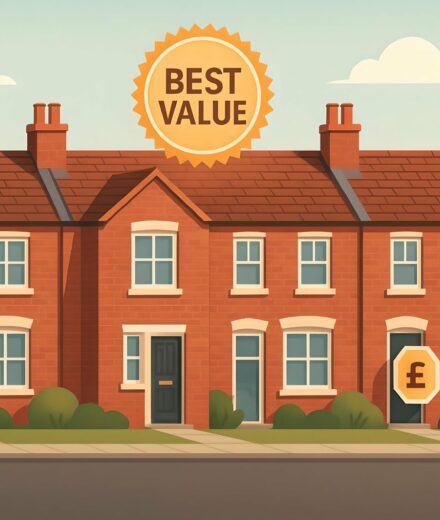

It’s easy to miss subtle shifts when you’re chasing big moves. Northampton’s progress has been quiet, but it’s showing up in the data.
The data on this page has been arranged to provide a structured and informative view of Northampton’s property market, highlighting changes across key metrics such as sale volume, average prices, and district-level shifts.
House Prices > Northampton
| Year | Average Price | Transactions |
|---|---|---|
| 2025 (proj.) | £307,200 | 5,415 |
| 2024 | £299,700 | 4,071 |
| 2023 | £299,900 | 4,696 |
| 2022 | £305,600 | 6,036 |
| 2021 | £289,300 | 6,954 |
| 2020 | £264,500 | 4,710 |
| 2019 | £254,100 | 5,384 |
| 2018 | £259,300 | 6,051 |
The property market in Northampton presents an intriguing snapshot of the past several years. From 2018 to the projected figures for 2025, we've seen a dynamic evolution in house prices and transactions.
The market has shown both resilience and ambition. Between 2018 and 2022, for example, average prices climbed from £259,300 to £305,600. However, 2023 saw a slight dip to £299,900, with 2024 edging slightly lower at £299,700, before bouncing back in 2025 with a projected average of £307,200. Picture the market as a river, meandering with some bends, yet always moving forward.
The number of transactions has its own tale to tell. From a high in 2021, with 6,954 transactions, there was a noticeable ebb by 2024 with 4,071 transactions. This flow is reminiscent of a bustling Northampton fair, full of life one year and quieter the next.
Several factors may be influencing these shifts:
Delving further, if you're curious about how Northampton stacks up against the UK average or where to find an affordable home, consider exploring our resource on How Expensive Is Northampton Compared to the UK Average?
Picture yourself wandering the charming streets of Northampton. It’s more than a vision—perhaps it’s where your journey begins.
Thinking ahead to your next home? Northampton has plenty of houses for sale right now.

Avg. Property Price: £412,400
Avg. Size of Property
1,321 sq/ft
Avg. Cost Per Sq/ft
£321 sq/ft
Total transactions
3,176 (since 2021)

Avg. Property Price: £268,600
Avg. Size of Property
916 sq/ft
Avg. Cost Per Sq/ft
£306 sq/ft
Total transactions
3,916 (since 2021)

Avg. Property Price: £218,500
Avg. Size of Property
927 sq/ft
Avg. Cost Per Sq/ft
£244 sq/ft
Total transactions
5,410 (since 2021)

Avg. Property Price: £151,700
Avg. Size of Property
640 sq/ft
Avg. Cost Per Sq/ft
£243 sq/ft
Total transactions
597 (since 2021)
In Northampton, the property market is as dynamic as ever, with a range of options that cater to different preferences and budgets. Each property type has its unique appeal and financial considerations, making Northampton a vibrant place to consider calling home.
Starting from the top, detached homes are like Northampton's premium offering. With an average property price of £411,100 and spanning approximately 1,320 sq ft, they provide an ideal option for families looking for more space and privacy. The cost per square foot of £320 is quite attractive for those prioritizing larger homes. Despite being on the more expensive side, these homes have seen a significant amount of interest with 3,152 transactions since 2021.
When it comes to flats, these properties are perfect for those seeking a more compact and efficient living space within a budget. Their average price sits at £151,500 with about 640 sq ft of space, making them a bit like the quintessential urban pad with plenty of appeal for young professionals. The competitive cost per square foot of £240 reflects their popularity in more central locations, as evidenced by the 593 transactions recorded.
Semi-detached homes offer a balanced middle ground. Averaging £268,600 and roughly 920 sq ft, they are popular among families needing additional room but who are not looking to stretch into the highest end of the market. The cost per square foot comes to £310. With 3,901 transactions, the data clearly indicates their sweet spot in providing both value and comfort.
Terraced houses, sometimes certain roads in Northampton seem to be hotter property than a last-minute Glastonbury ticket. These homes are truly the heart of Northampton's market activity with 5,378 transactions. Averaging £218,600 with £240 per sq ft across 930 sq ft, they are the perfect pick for first-time buyers or those looking to invest in buy-to-let opportunities.
| District | Avg Price (£) | Transactions |
|---|---|---|
| NN1 | £216,600 | 4,231 |
| NN2 | £249,800 | 5,626 |
| NN3 | £267,800 | 7,922 |
| NN4 | £296,900 | 6,519 |
| NN5 | £249,300 | 5,753 |
| NN6 | £361,200 | 4,861 |
| NN7 | £361,300 | 3,317 |
Northampton's housing scene is a vibrant mix of character, boasting prices that vary across its cherished districts. This diversity showcases not just financial figures but a narrative of Northampton's evolving identity.
Let’s walk through the more accessible areas. In NN1, homes average around £216,600. This area pulsates with urban charm, making it ideal for those looking to stay connected to the town's core, without breaking the bank. It's the perfect space for those yearning to be amidst the hustle and bustle, without a wallet-breaking price tag.
Looking for something with a bit more balance? NN3 and NN5 might just strike that sweet spot. With average property values of £267,800 and £249,300 respectively, they offer a blend of suburban tranquility seated not too far from the city conveniences. Here, the leafy streets welcome families who treasure both accessibility and community spirit.
For those seeking premium living, NN6 and NN7 stand tall with commanding average prices just above £361,200. These districts speak to buyers longing for a slice of luxury, coupled with picturesque surroundings. It’s the strategic game of chess in Northampton's property market — choose well, and you're set for a future rooted in elegance and comfort.
We can't skip out on NN4, capturing interest with its average price of £296,900. It's the bridge between premium living and grounded Northampton culture, perfect for those who strive to experience both modernity and tradition.
Northampton tells a story of diversity in its housing market. Whether you’re hunting for a vibrant city life, a peaceful retreat, or somewhere in between, this town welcomes all with open arms. Thinking of making a move? Dive into the details on where property prices are climbing.
Please also check out the following areas in [CITY] for further insights:
| City | Avg Price (£) | Transactions |
|---|---|---|
| Towcester | £359,000 | 3,149 |
| Wellingborough | £243,200 | 8,123 |
| Olney | £424,900 | 1,101 |
| Daventry | £268,900 | 4,017 |
| Rushden | £231,500 | 3,913 |
| Kettering | £244,900 | 10,256 |
| Newport Pagnell | £327,100 | 1,809 |
| Market Harborough | £341,800 | 4,530 |
| Milton Keynes | £317,400 | 16,063 |
| Rugby | £276,000 | 10,740 |
When examining house prices in Northampton compared to its neighbours, a collection of insights surface, painting a vibrant picture much like houses lining the historic streets of the town. Here's the lay of the land:
These contrasting figures highlight the diverse characteristics of each area:
So what's the core message? Northampton proves to be a ground filled with opportunities, offering a compelling mix of market dynamics and housing diversity. Whether it's the hustle of urban life or the embrace of rural calm, each area brings its unique flavour to potential homeowners.
Just a reminder, these figures compare simple averages for price and number of sales.
This data leaves out property sizes and square foot costs, so full trends might not be visible. See more detail at our blog. Thank you.
Our tools reshape trusted UK property data using practical logic and clean corrections, producing impressively refined street-level results. Watch how the model works
Our site uses cookies. By using this site, you agree to the Privacy Policy and Terms of Use.