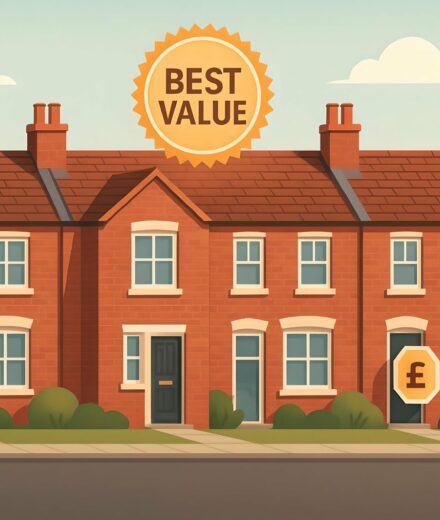

While others zigzag, Chesterfield just keeps moving forward. It might not be dramatic, but the momentum is definitely there.
This page serves as a practical tool for understanding what’s happening in Chesterfield’s housing market right now, providing detailed breakdowns across pricing bands, districts, and recent time periods.
House Prices > Chesterfield
| Year | Average Price | Transactions |
|---|---|---|
| 2025 (proj.) | £218,800 | 3,374 |
| 2024 | £212,700 | 2,511 |
| 2023 | £225,000 | 3,243 |
| 2022 | £223,400 | 3,783 |
| 2021 | £216,700 | 4,407 |
| 2020 | £198,800 | 3,101 |
| 2019 | £187,000 | 3,325 |
| 2018 | £180,600 | 3,247 |
Chesterfield’s property market has rarely stood still since 2018. Prices have charted a brisk, upward path, peaking in 2023 before retracing slightly in 2024, with another gentle lift projected for 2025. These oscillations reflect a market shaped equally by demand, uncertainty, and economic crosswinds.
For fast-movers, Chesterfield is still a place where value and ambition intersect. Rising prices are prominent, but so are those market jitters hidden beneath the averages. The market’s tempo says plenty about prevailing sentiment: exuberant in growth years, restrained in times of doubt.
Interested in extracting hidden value or benchmarking against a looming future? See Chesterfield House Prices: What’s Your Property Worth in 2025? for deeper, street-level analysis.
“As the locals say, in Chesterfield, the bricks know when to stand tall and when to hunker down.”
Wondering what’s for sale nearby? Take a scroll through our homes currently selling in Chesterfield.

Avg. Property Price: £341,900
Avg. Size of Property
1,258 sq/ft
Avg. Cost Per Sq/ft
£278 sq/ft
Total transactions
1,975 (since 2021)

Avg. Property Price: £199,600
Avg. Size of Property
904 sq/ft
Avg. Cost Per Sq/ft
£226 sq/ft
Total transactions
2,144 (since 2021)

Avg. Property Price: £150,600
Avg. Size of Property
835 sq/ft
Avg. Cost Per Sq/ft
£184 sq/ft
Total transactions
1,215 (since 2021)

Avg. Property Price: £114,400
Avg. Size of Property
623 sq/ft
Avg. Cost Per Sq/ft
£187 sq/ft
Total transactions
139 (since 2021)
Wander Chesterfield’s property scene and you will sense its rhythms are anything but static. Prices dance from one end of town to the other, reflecting not only traditional demand but a quiet pulse of change in what buyers truly value. Detached homes, with their broad plots and privacy, take the crown for highest value. These rarely hang around for long, and when they do move, it’s with the determination of a supporter legging it from the Proact Stadium to beat the crowds after a local derby. In this bracket, the cost per square foot is towering, yet buyers are obviously drawn in by gardens, garages, and the feeling of space that’s hard to find elsewhere in Derbyshire.
Semi-detached homes provide a middle ground that is surprisingly competitive. Their transaction numbers streak ahead of every other type, hinting at just how highly Chesterfield families rate that blend of value and a bit of elbow room. These houses rarely linger on the open market; demand sends sales briskly through, almost as quick as traffic on Sheffield Road at 9am. There’s an unmistakable sense that semi-detached homes, perched between budget and comfort, are the go-to for those wanting it all without breaking the bank.
Terraced housing, historically the lifeblood of Chesterfield’s inner neighbourhoods and colliery villages, sits at the more affordable end of the spectrum. Despite their snug size, the number of transactions since 2021 points to a strong appetite among first-time buyers, as well as city migrants priced out of larger metro areas. The cost per square foot may be lower, but what you get is a foothold in the market, and often, a lively street atmosphere where neighbours know each other by name. It is urban compactness at its most sociable.
Flats, meanwhile, tell a different story. The volume of flat transactions is relatively subdued, possibly reflecting limited new developments and a tendency among buyers to prefer houses over apartments. Even so, they remain a genuine option for singles, students, or anyone wanting to live right by the town centre. The cost per square foot is competitive, but small volumes hint at constrained supply. The market is as tight as morning traffic on the A617 – slow, occasionally frustrating, and packed with people chasing limited opportunities.
Not sure where you fit? For an in-depth breakdown of what Chesterfield’s next hotspots could be, see which streets may be on the cusp of big changes.
| District | Avg Price (£) | Transactions |
|---|---|---|
| S40 | £212,100 | 4,137 |
| S41 | £207,900 | 4,907 |
| S42 | £236,200 | 4,386 |
| S43 | £182,200 | 4,942 |
| S44 | £188,300 | 3,265 |
| S45 | £220,400 | 2,158 |
Distinct districts in Chesterfield tell a surprisingly vivid story when it comes to how property prices and transaction levels play out. If you peer beyond the big averages, you spot subtle opportunities and the push-pull of demand between established neighbourhoods, ambitious up-and-comers and those still holding out for attention.
Let’s start with a note of steady, moderate growth. In some areas, property prices are tiptoeing up — not a sprint, but a steady drumbeat of progress. Yet, when you look closer, this rhythmic rise is anything but evenly distributed. Chesterfield’s housing market has its favourites, with certain postcodes regularly outpacing others and a few flying quietly under the radar.
For example, S42 confidently holds the crown for highest average price among Chesterfield districts, reflecting its reputation for detached homes, green outlooks, and that sought-after village feel. Houses here draw in buyers who want space and a bit of countryside breathing room, even if they pay a premium for the privilege. Yet, it’s not the busiest market, with only a modest volume of property transactions compared to some neighbours.
Contrast that with S43 and S44, where the buzz of activity feels almost as lively as Vicar Lane on market day. These postcodes see the highest number of transactions – likely thanks to a mix of more accessible pricing and larger existing housing stock. Young couples and families, especially, have been flocking here for a chance at a well-sized semi or terrace that doesn’t break the budget. Yet, prices here remain toward the more affordable end, creating niches for value-focused buyers who aren't chasing top-of-the-market status.
Meanwhile, S40, S41 and S45 form Chesterfield's balanced middle. They offer solid value and stable resale opportunities, each blending proximity to the centre with quieter residential pockets ideal for those seeking a blend of convenience and peace.
Thinking of planting roots or investing in Chesterfield? Your experience will be shaped by which district you choose — price, pace and long-term opportunity differ street by street. For a sharper sense of current values and possible next steps, see our full guide to Chesterfield house prices for 2025.
Please also check out the following areas in Chesterfield for further insights:
| City | Avg Price (£) | Transactions |
|---|---|---|
| Dronfield | £278,900 | 1,869 |
| Alfreton | £188,700 | 3,751 |
| Sutton-In-Ashfield | £157,300 | 4,137 |
| Matlock | £296,300 | 2,700 |
| Sheffield | £212,900 | 46,115 |
| Mansfield | £173,900 | 12,190 |
| Bakewell | £421,500 | 613 |
| Worksop | £182,200 | 6,042 |
| Ripley | £195,100 | 2,178 |
| Hope Valley | £412,800 | 647 |
House prices in Chesterfield compete in a fascinating league of their own. Neighbouring areas put on quite a show, showing distinct personalities that shape trends and buyer behaviour. With that said, the gap between desirable villages, market towns and larger cities is striking—and full of opportunity for the eagle-eyed.
Bakewell and Hope Valley claim the region’s luxury crown, with prices rising high—almost ballooning like kids chasing soap bubbles on a summer’s day. These picturesque Derbyshire hotspots draw serious buyers chasing scenic views and period homes, their average house prices standing head and shoulders above their neighbours. For some, it’s a dreamy, “move here and never leave” scenario.
Matlock and Dronfield land closer to Chesterfield’s price point, comfortably situated in the mid-to-upper tier. Here you’ll find robust, reliable demand and an intriguing mix of classic stone terraces and newer executive homes. Alfreton, Worksop, Ripley, and Mansfield bring a more accessible flavour, with noticeably lower prices. These are the stomping grounds for families and local movers looking for value rather than prestige, especially those happy to commute or swap some scenery for a boost in living space.
Urban giants like Sheffield create a different rhythm entirely. Despite being a large and busy city, the average house price sits closer to Alfreton than Bakewell, thanks to a more eclectic housing stock. High student populations and a supply of smaller terraces keep the market buoyant and fast-moving—much like the city buzzes on a matchday. Sheffield registers enormous sales volume, which tells us serious momentum lies in urban centres, even if values don’t peak as sharply as in rural hotspots.
Chesterfield’s setting is its trump card: It's close to stunning countryside, lively city amenities, and some of Derbyshire’s most prized property addresses. For buyers, that means options—whether you crave a rural view or a shortcut to urban convenience.
Please be mindful, these figures highlight only average price levels and number of transactions.
They do not adjust for differences in property size or cost per square foot. Because of this, some patterns may be hidden. For a deeper breakdown, head over to our blog. Thank you for reading.
Instead of looking at general averages, we rework individual figures to reflect each home’s unique qualities and context. Explore how the process works
Our site uses cookies. By using this site, you agree to the Privacy Policy and Terms of Use.