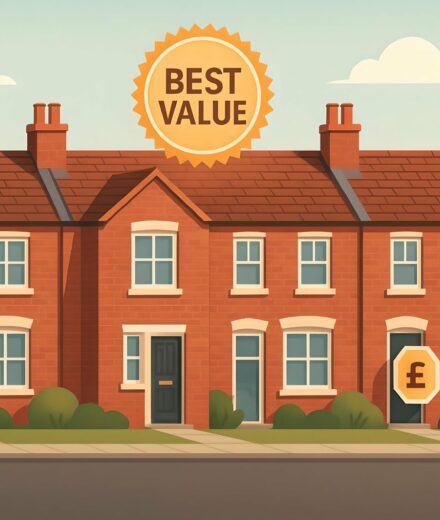

See how every major property type in Bedford has performed annually by district, with consistent comparisons to nearby towns.
You’ll also see whether Bedford is experiencing balanced growth or isolated hotspots when viewed alongside local peers.
House Prices > Bedford
| Year | Average Price | Transactions |
|---|---|---|
| 2025 (proj.) | £375,900 | 4,220 |
| 2024 | £367,600 | 2,882 |
| 2023 | £367,700 | 3,237 |
| 2022 | £372,100 | 4,362 |
| 2021 | £349,000 | 5,566 |
| 2020 | £328,600 | 4,169 |
| 2019 | £320,800 | 4,649 |
| 2018 | £322,300 | 4,673 |
If you have been watching the Bedford housing market since 2018, you will recognise a market that’s both resilient and, at times, surprisingly spirited. While the average property value has drifted upwards, transaction numbers have danced about with a rhythm of their own. It’s a story of momentum and pause, more like the ebb and flow of the River Great Ouse than a straight, predictable line.
For those considering a move: If you are eyeing the Bedford market, patience and timing could make a real difference. Prices have proven robust but not runaway, meaning that the right home at the right price is still a real prospect. Sellers and buyers alike may wish to keep a close eye on the quieter months for the biggest opportunities, or visit our Bedford home valuation guide for practical insights into your next steps.
Bedford’s market thrives on a blend of consistent growth, underlying resilience, and sudden bursts of competition. Whether you are searching for a new family home or thinking about your first step onto the market, Bedford remains welcoming, steady, and—like its river—full of little surprises just when you think things have settled.
There’s never a bad time to scout the market. Start with our current home listings in Bedford.

Avg. Property Price: £512,900
Avg. Size of Property
1,490 sq/ft
Avg. Cost Per Sq/ft
£357 sq/ft
Total transactions
1,754 (since 2021)

Avg. Property Price: £348,200
Avg. Size of Property
1,041 sq/ft
Avg. Cost Per Sq/ft
£346 sq/ft
Total transactions
1,821 (since 2021)

Avg. Property Price: £251,200
Avg. Size of Property
821 sq/ft
Avg. Cost Per Sq/ft
£311 sq/ft
Total transactions
1,940 (since 2021)

Avg. Property Price: £189,800
Avg. Size of Property
621 sq/ft
Avg. Cost Per Sq/ft
£308 sq/ft
Total transactions
516 (since 2021)
Bedford’s property market continues to buzz with energy, shaped by swings in demand across every type of home. Prices are vividly tiered, with detached houses drawing a clear line at the top, and flats nestling into the entry level. Patterns since 2021 reveal a market that’s as dynamic as the River Great Ouse during a wet spring. Notably, transacted sales have favoured family-sized homes, sharpening the story of “value for space” in Bedford’s patchwork of neighbourhoods.
Detached homes don’t just stand apart—they command a premium, pulling in higher values thanks to their spaciousness and coveted privacy. With larger plots and modern amenities, buyers are drawn to detached properties for their long-term comfort and ability to stretch out, both literally and figuratively. Yet, it's the cost per square foot that really highlights their desirability, sitting higher than other types and reinforcing the perception that true “room to breathe” comes at a price in Bedford.
Semi-detached and terraced houses, meanwhile, are showing far more than a steady pulse—they’re briskly trading hands. The volume of transactions for these property types dwarfs detached and flat figures, which hints at their broad-based appeal. Young families and up-sizing locals are regularly outbidding each other for these properties, which blend value, location, and that all-important bit of extra space. The average cost per square foot remains competitive, making these homes quintessentially “Bedford” for buyers aiming to maximise value in established neighbourhoods.
Terraced homes, always a sturdy backbone of the market, continue to make waves among first-time buyers and savvy investors. Their achievable pricing and solid rental track record keep them firmly in demand. The activity level for terraced property sales since 2021 outpaces every other category. This level of churn is a testament to their popularity, especially in Bedford’s central districts.
Flats are the wild card. They attract buyers who prioritise location, easy maintenance, and a foot on Bedford’s property ladder. Trends show fewer flat transactions, meaning choice is limited and competition for the best spots can get fierce. With their smaller footprints and palatable upfront costs, flats can offer a handy first move or a smart investment checkout.
Buyers should note: pricing in Bedford has been bouncing around like a rubber ball in a small room, so valuation accuracy is paramount. For those keen to lock in fair value, our guide on avoiding undervaluing your home in Bedford is a must-read.
| District | Avg Price (£) | Transactions |
|---|---|---|
| MK40 | £313,000 | 4,721 |
| MK41 | £318,300 | 4,226 |
| MK42 | £284,100 | 6,616 |
| MK43 | £373,600 | 5,837 |
| MK44 | £436,900 | 1,872 |
| MK45 | £394,900 | 6,505 |
If Bedford’s property market were a lively market day along the Embankment, you’d find some stalls dazzling with luxury goods while others offer hidden gems for the sharp-eyed buyer. Each district tells its own story, with budgets and buying hunger swirling in an unpredictable dance.
The districts on the edges of town—MK44 and MK45—wear their price tags with pride. Property prices here reach noticeably higher peaks, magnetising those who crave broad gardens, countryside sunsets, and plenty of space to sprawl. There’s an unmistakable air of exclusivity in these leafy zones: for buyers chasing grandeur, MK44 especially delivers plush addresses and a more sedate lifestyle away from the town’s animated heart.
Swing over to the core of Bedford (MK40 and MK41) and you’ll find a different tempo. These districts balance wanted amenities with community warmth. Prices in this pocket remain competitive, drawing a variety of buyers—especially families keen to stay within reach of town life yet still get respectable homes for their money. MK41 and MK40 often see a steady flow of completed sales, indicating that appetite for ‘walk-everywhere’ convenience has not cooled.
Then there’s MK42. This neighbourhood is like a popular café on a Saturday morning—buzzing, approachable, and energetic. It’s where first-time buyers and savvy value-seekers can actually get a foot in the door without feeling like they’re bidding at an auction during cup final season. With more transactions on the books than any other Bedford district, it’s obvious things are moving faster here than the River Great Ouse after a spring rainstorm.
If rolling countryside and village charm call your name, don’t forget about MK43. Prices tick up a little, but you’re rewarded with quieter lanes and grander homes. This area seems to strike a middle ground—roomy properties, a slice of Bedfordshire’s softer pace, but without the eye-watering sums of its priciest neighbours.
Bedford’s property market is a competitive stage, each district with its own tempo and allure. Whether you’re eager to nab a starter home in a buzzing community or aiming for that show-stopping rural retreat, you’ll find options as varied as a Saturday boot sale—if you know where to look.
Please also check out the following areas in Bedford for further insights:
| City | Avg Price (£) | Transactions |
|---|---|---|
| Shefford | £394,100 | 1,651 |
| Biggleswade | £347,500 | 3,600 |
| Sandy | £339,400 | 2,033 |
| Olney | £424,900 | 1,101 |
| Henlow | £396,500 | 787 |
| Newport Pagnell | £327,100 | 1,809 |
| Arlesey | £319,400 | 760 |
| St Neots | £307,900 | 3,510 |
| Milton Keynes | £317,400 | 16,063 |
| Rushden | £231,500 | 3,913 |
When stacking Bedford’s house prices up against its neighbouring towns and villages, a complex but fascinating picture comes into focus. Patterns here are not uniform – value, pace, and “feel” blend together in ways that give every place its own personality.
Transaction volume stands out the most. While some local markets tick along quietly, others are positively bustling. Those high-transaction towns suggest serious demand – property changing hands with the energy of a Saturday market in Bedford’s Corn Exchange.
There’s a clear price gradient from north to south, but also a ripple effect – as values “climb steadily like hikers on Sharpenhoe Clappers”, demand radiates out. Commuters, first-buyers, and families are all sizing up what fits.
So what does all this actually mean? Where Bedford and its neighbours thrive, it’s often down to energy, variety, and the subtle push-pull of price vs. activity. Whether you’re chasing action or a slice of tranquillity, this patch of the East has something ready and waiting.
Just a reminder, the numbers here show simple property price averages and recorded transactions.
They do not adjust for differences in property size or cost per square foot. For a closer view, head over to our blog. Thank you.
We look at price differently. By cleaning up messy figures and adding smart logic, we give users a calm, structured view of what homes are really worth. See why our figures hold up
Our site uses cookies. By using this site, you agree to the Privacy Policy and Terms of Use.