
House Prices > Peterborough
| Year | Average Price | Transactions |
|---|---|---|
| 2025 (proj.) | £279,800 | 4,706 |
| 2024 | £269,500 | 3,328 |
| 2023 | £269,800 | 3,899 |
| 2022 | £265,100 | 5,245 |
| 2021 | £248,700 | 6,133 |
| 2020 | £239,600 | 4,262 |
| 2019 | £223,200 | 5,009 |
| 2018 | £215,500 | 5,068 |
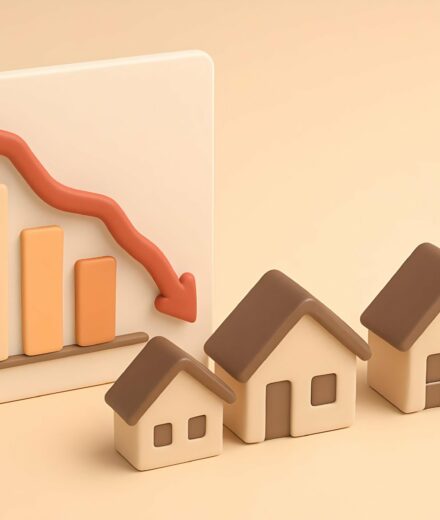
Peterborough’s property prices have taken an undaunted leap upward in recent years. Since 2018, the average price has climbed from just over £215,500 to a projected £279,800 in 2025. That upward swing signifies an estimated 30% increase in only eight years. Compared to other East Midlands hubs, Peterborough’s rise is strikingly sustained, even if it occasionally feels as unpredictable as the wind whipping across the Fens.
But there’s a second story to be told, and it’s etched deep in the transaction numbers:
What’s driving these contrasting trends? We see several plausible explanations:
If you’re thinking of making a move, just remember: buying in Peterborough today feels a bit like grabbing a deckchair on the Titanic — timing is everything and there are no guarantees. Prices look robust, but the transaction slowdown is a warning flag waving beneath the apparent calm.

Avg. Property Price: 354,300
Avg. Size of Property
1,275 sq/ft
Avg. Cost Per Sq/ft
£287 sq/ft
Total transactions
2,033 (since 2021)

Avg. Property Price: 234,000
Avg. Size of Property
953 sq/ft
Avg. Cost Per Sq/ft
£253 sq/ft
Total transactions
2,419 (since 2021)

Avg. Property Price: 180,100
Avg. Size of Property
827 sq/ft
Avg. Cost Per Sq/ft
£226 sq/ft
Total transactions
2,646 (since 2021)

Avg. Property Price: 130,700
Avg. Size of Property
622 sq/ft
Avg. Cost Per Sq/ft
£213 sq/ft
Total transactions
427 (since 2021)
Peterborough’s property market is anything but boring. Differentiation by property type is stark, painting a digital tapestry of buyer priorities, ambitions and pocket size. Here, detached homes are the crown jewels, commanding the highest entry point but delivering palatial roominess most buyers can only dream of. Swing open the smart-lock doors, and you’ll find not just ample space, but the rise of high-tech, energy efficient living that is becoming increasingly coveted across Cambridgeshire. These homes often sit in sought-after neighbourhoods where buyers with bigger budgets are hungry for both smart features and privacy.
Semi-detached homes, meanwhile, fit perfectly in Peterborough’s “middle lane” for smart living. Families needing extra space for gadgets, home offices, or green tech upgrades will see good value here. Their popularity is palpable as shown by the sheer volume of transactions—the highest for this segment—suggesting that many Peterborians are actively seeking a balance between traditional comforts and modern efficiency.
Terraced properties remain the vibrant backbone of Peterborough’s urban sprawl. Their accessibility keeps them in high demand—think of them like energy-efficient hybrids, steadily running the city’s engine. Despite their smaller footprint, they offer a smart step onto the housing ladder for young professionals or smaller families, particularly in up-and-coming areas where digital connectivity is just as prized as a second bedroom. The fact they notch up the most sales since 2021 underscores how desirable, flexible and fast-moving these homes remain.
At the other end of the spectrum, flats are the clear winners for those who crave low-maintenance living, and perhaps a tech-enabled, minimalist lifestyle. While their average price sits at the lower end of the scale, you’re still likely to find features such as video entry, lightning-fast fibre, and communal spaces surprisingly common even in these compact spaces. Even so, the lower transaction volumes reflect their role as either starter homes, or smart bolt-holes for those needing lock-and-leave simplicity.
So, what’s the summary? Your ideal property type depends on your budget, appetite for tech and desire for space. If stretching your budget for a detached “smart palace” feels too much, Peterborough has plenty of efficient, adaptable choices at every level. Want to pinpoint where your money goes furthest? Explore Peterborough streets with the best blend of value and future growth.
| District | Avg Price (£) | Transactions |
|---|---|---|
| PE1 | £189,300 | 4,368 |
| PE2 | £219,200 | 6,616 |
| PE3 | £239,900 | 2,702 |
| PE4 | £212,900 | 3,395 |
| PE5 | £435,700 | 138 |
| PE6 | £283,200 | 5,195 |
| PE7 | £256,200 | 8,774 |
| PE8 | £366,700 | 2,008 |
The Peterborough housing market moves in mysterious ways, a bit like the springtime weather rolling across Cathedral Square — unpredictable, laced with sudden change, and never short of surprises. In 2025, these quirks play out across the city’s patchwork of districts, with each neighbourhood carving out its own niche on the price spectrum.
Affordable city living still has deep roots in Peterborough, especially close to the beating heart of the centre. Districts like PE1 remain accessible for those wanting to put down roots without stretching to London or Cambridge budgets. These areas continue to attract a vibrant mix of first-time buyers, creative professionals and hardworking locals drawn to the lively buzz and convenience on offer.
Swing a little further out and it's a different story. Districts such as PE5 shimmer at the top end, catching the eye of those seeking exclusivity, spacious gardens and that all-important privacy. Prices here leap far beyond what most can reach — but they set the city apart in the regional market. With fewer sales but standout prestige, these suburbs are magnets for buyers who place a premium on breathing space, both inside and out.
Meanwhile, areas such as PE7 and PE6 are busier than the Embankment on a summer Saturday, seeing the highest transaction volumes in Peterborough. These districts sit in that sweet spot where pricing is just right, schools are good, and community ties run deep. It’s no wonder so many families and upwardly mobile professionals choose them — and for sharp-eyed investors, the churn of sales hints at solid long-term potential. If you’re keen to focus your search on value-rich pockets, discover Peterborough’s best streets for value & future growth.
The striking contrast between districts highlights a market still rich with choice. Buyers can opt for attainable neighbourhoods with genuine soul, or make a bid for palatial luxury in Peterborough’s most desirable leafy fringes. The city keeps pace — but in its own unpredictable, sometimes eccentric way.
So what's the core message? In Peterborough, unpredictability rules — and whether you’re seeking affordability, aspiration, or something utterly unique, there’s always a pocket that fits just right.
Please keep in mind, these figures are based solely on district averages for sale price and transaction volumes.
Property sizes and cost per square foot have not been factored in, so some patterns could be blurred. For a full district breakdown, head over to our blog. Thanks for stopping by.
| City | Avg Price (£) | Transactions |
|---|---|---|
| Stamford | £348,600 | 3,001 |
| Bourne | £244,000 | 3,279 |
| March | £230,800 | 3,130 |
| Chatteris | £221,900 | 1,397 |
| Huntingdon | £314,900 | 6,931 |
| Spalding | £217,500 | 7,267 |
| Wisbech | £230,600 | 4,675 |
| Corby | £218,500 | 7,638 |
| Oakham | £313,200 | 2,622 |
| Kettering | £244,900 | 10,256 |
House prices in and around Peterborough march upward like keen hikers pacing across the gentle slopes of Ferry Meadows. Zooming out to the region, there is a distinct gap between “destination” towns, like Stamford and Oakham, and the more accessible areas such as Spalding and Wisbech. If you’re weighing up a move to Peterborough, it’s crucial to understand how your budget stands compared to what’s on offer just up or down the A16 or over in the market towns to the west.
From our side, we’ve noticed that families in and around Peterborough are branching out into satellite towns more than ever, pushed on by stretching prices and the perennial desire for an extra room or bigger garden. The once-quiet edges are now buzzing livelier than the Embankment after a summer festival.
“As locals around Peterborough say, the right postcode can open doors you never knew existed.”
Please keep in mind, this section focuses solely on average property pricing and overall transaction counts.
Property size and cost per square foot are not factored in, meaning some shifts may be missed. To explore further, visit our blog.
We bring clarity to complex property data, adjusting key figures until the results speak clearly - no exaggeration, no shortcuts. Read more about our method
Our site uses cookies. By using this site, you agree to the Privacy Policy and Terms of Use.