
House Prices > Mansfield
| Year | Average Price | Transactions |
|---|---|---|
| 2025 (proj.) | £202,000 | 2,742 |
| 2024 | £193,500 | 1,938 |
| 2023 | £191,500 | 2,337 |
| 2022 | £195,800 | 3,023 |
| 2021 | £185,600 | 3,430 |
| 2020 | £169,200 | 2,727 |
| 2019 | £163,500 | 2,951 |
| 2018 | £150,100 | 2,791 |
If Mansfield’s property market was a classic Yorkshire pudding, it would be one of those delightfully robust ones that just keeps rising, with the odd wobble when the oven door opens unexpectedly. Since 2018, the average property price has strutted upwards with impressive tenacity (and perhaps a sprinkle of northern stubbornness), even if the number of sales had its moments of enthusiastic sprinting and then a gentle jog.
What could be fuelling all this?
For anyone peering anxiously at their own bricks and mortar, it’s worth asking: Is Your Home Undervalued in Mansfield? Here’s How to Check.
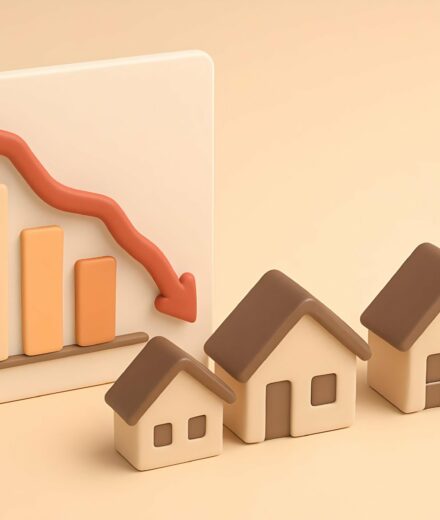
Even on a rainy Mansfield morning, house prices keep heading upwards - with an approximate 35% gain since 2018, resilience clearly runs thicker than the gravy on a Sunday roast.

Avg. Property Price: 301,400
Avg. Size of Property
1,256 sq/ft
Avg. Cost Per Sq/ft
£248 sq/ft
Total transactions
1,493 (since 2021)

Avg. Property Price: 172,400
Avg. Size of Property
907 sq/ft
Avg. Cost Per Sq/ft
£194 sq/ft
Total transactions
1,628 (since 2021)

Avg. Property Price: 123,100
Avg. Size of Property
852 sq/ft
Avg. Cost Per Sq/ft
£149 sq/ft
Total transactions
1,081 (since 2021)

Avg. Property Price: 104,700
Avg. Size of Property
676 sq/ft
Avg. Cost Per Sq/ft
£157 sq/ft
Total transactions
160 (since 2021)
Mansfield’s property market tells a vivid story in numbers, with sharp contrasts across different housing types since 2021. Detached homes stand out at the summit, with their hefty price tags and expansive footprints, while flats and terraced houses sit at the more accessible end of the spectrum. The sheer differentiation in figures is a nod to the diverse appetites of buyers, from those craving space and status, to savvy investors looking for efficiency per pound.
Detached properties in Mansfield command a striking premium. With their generous 1,260 sq/ft average footprint and a £250 per sq/ft cost, these homes are emblematic of ambition and comfort. It’s no wonder buyers have recorded a remarkable 1,481 transactions in this segment, accounting for a significant slice of the higher-end market activity. For families and upgraders with deeper pockets, detached houses represent more than just bricks and mortar – they offer privacy, garden space, and the breathing room to grow roots.
The market for semi-detached houses hums with steady, robust energy. These properties hit a valuable sweet spot, balancing generous living space around 910 sq/ft with a moderate £190 per sq/ft outlay. With a lively 1,625 transactions since 2021, semi-detached homes are moving faster than a market stall queue on a cold Mansfield morning. They remain the pragmatic choice for aspiring homeowners and growing families wanting affordability without sacrificing space.
Terraced houses tell another tale entirely. Their modest size and budget-friendly price points make them a perennial favourite among first-time buyers and smaller households. With typical floor areas running about 850 sq/ft and a very competitive £150 per sq/ft, terraced homes keep Mansfield’s entry-level property ladder sturdy and accessible. Activity remains strong as evidenced by 1,078 transactions since 2021. They remain an astute way to get a foothold for those not wanting to overstretch.
Flats in Mansfield, meanwhile, offer a compact and streamlined style of living. At around 680 sq/ft with a slender £160 per sq/ft cost, flats appeal to urbanites and solo buyers. Even so, just 160 transactions have been recorded in recent years, hinting that local preference still tilts towards homes with gardens and a little more elbow room.
While property prices across the board reflect Mansfield’s reputation for relative affordability (£146,000 average price), the diversity between types is starker than a winter's morning by Carr Bank Park. Every property type plays a unique strategic role in the market’s grand game of chess, with buyers calculating the best moves for their budget, lifestyle, and long-term plans.
| District | Avg Price (£) | Transactions |
|---|---|---|
| NG18 | £194,900 | 6,044 |
| NG19 | £166,700 | 6,552 |
| NG20 | £147,500 | 3,083 |
| NG21 | £195,700 | 3,665 |
Mansfield’s blend of historic industry and swirling green belts finds vivid expression in its property prices, with each district painting a different picture. Here, price points ripple across the map, echoing subtle differences in ambiance, access, and opportunity.
In districts like NG18 and NG21, there’s a gentle hum of aspiration. Homes fetch noticeably higher average prices, and the air feels slightly crisper in the mornings—more established trees, more pride in the parkways, perhaps. These postcodes have a sense of comfort and established neighbourhoods, delivering steady energy that’s reflected in the steady pace of transactions.
NG19 tells a different story. Bustling, full-bodied and remarkably active, this district rings with the animated chatter of more property sales than any other in Mansfield. Prices here are more accessible—families step onto the ladder, schools buzz at drop-off, and local shops seem perpetually busy. It’s a bit like the A60 at eight in the morning: movement everywhere, the market rarely standing still.
Then there’s NG20, the area where affordability speaks loudly, and savvy buyers sniff out opportunities like a miner’s canary in a rich seam. The price tag is much more approachable, making it attractive for first-timers, bargain hunters, or buy-to-let investors. Yet, with fewer total sales, there’s an underlying sense of calm, almost as if the village High Street is quieter than Mansfield Market on a drizzly Thursday.
If you’re crunching numbers and questioning whether your chosen district is a shrewd pick, there’s more to weigh up than just the top line figure. Is Your Home Undervalued in Mansfield? Here’s How to Check brings insight into whether your area’s got heaps of hidden value, or if you’re due a rethink.
Each district’s pricing is its own brushstroke in Mansfield’s living canvas. Whether you crave the bustle or prefer the hush, there’s a postcode with your name humming gently beneath the surface.
Please note that this section looks only at average pricing and total transaction numbers for each district.
Since average property size and price per square foot are not included, the data might not fully reveal underlying patterns. For a deeper look at Mansfield’s districts, head over to our blog. Thank you for your interest.
| City | Avg Price (£) | Transactions |
|---|---|---|
| Sutton-In-Ashfield | £157,300 | 4,137 |
| Alfreton | £188,700 | 3,751 |
| Southwell | £360,200 | 958 |
| Chesterfield | £204,800 | 14,227 |
| Worksop | £182,200 | 6,042 |
| Ripley | £195,100 | 2,178 |
| Heanor | £170,800 | 1,803 |
| Nottingham | £213,300 | 51,193 |
| Ilkeston | £174,300 | 5,167 |
| Newark | £234,500 | 8,113 |
The Mansfield housing market moves in mysterious ways - a bit like the weather on Berry Hill! Here, you’ll find a fascinating mix of prices, with some neighbouring areas clocking in far higher, and others offering snug value for cash-strapped buyers. Mansfield is strikingly affordable compared to some nearby hotspots, yet demand remains impressively resilient around town and beyond.
If we look across the border:
Thinking about buying in Mansfield? You’re likely to find prices holding steady as a proper Sunday roast. There’s room for growth, too, especially with neighbouring areas nudging up market averages. At M0VE, we’ve seen Mansfield buyers get more garden for their money, while still enjoying quick trips into town or out to the Peak District. It’s the best of both worlds.
The takeaway is simple: Mansfield is surrounded by a patchwork of bustling markets, with plenty of space for every kind of buyer. If you’re on the fence, the current mix of value, variety, and future potential might just tempt you off it.
Please note, these comparisons focus just on average price points and transaction activity.
This data leaves out property sizes and square foot costs, so full trends might not be visible. See more detail at our blog. Thank you.
We offer something many platforms don’t: pricing that’s been shaped with care, and corrected where needed to reflect actual value. Find out how the details are handled
Our site uses cookies. By using this site, you agree to the Privacy Policy and Terms of Use.